Download
1 / 14
140 likes | 241 Views
Uses of Safety Performance Functions and Potential for Safety Improvement Values. David L. Piper, P.E. Illinois Department of Transportation. Applications of SPF and PSI. Using the HSIP Five Percent Report Safety Analysis in Phase I Quantitative Site Analysis.

E N D
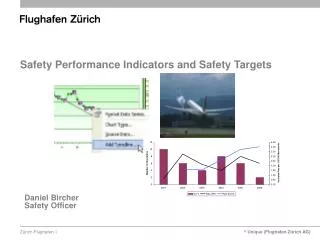
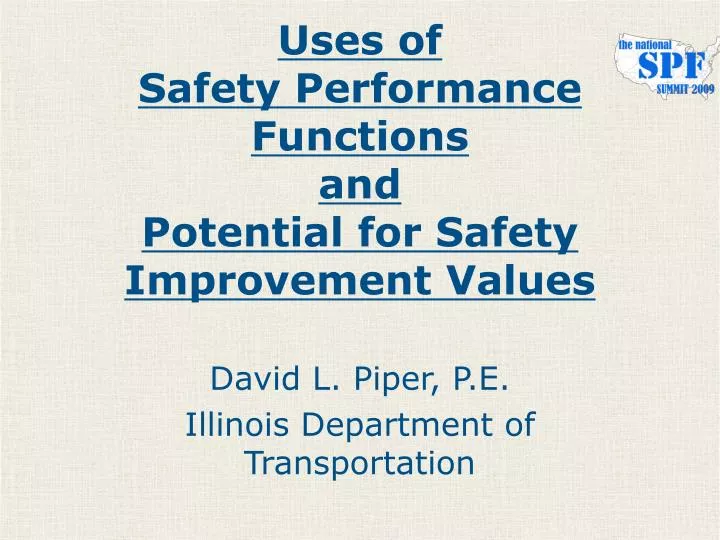
Uses ofSafety Performance FunctionsandPotential for Safety Improvement Values David L. Piper, P.E. Illinois Department of Transportation
Applications of SPF and PSI Using the HSIP Five Percent Report Safety Analysis in Phase I Quantitative Site Analysis
Using the HSIP Five Percent Report • Is my location a “5%” site? • Map • Illinois Roadway Information System (IRIS) location
Five Percent Reporting Fixed Object and Overturn = 51% PSI = 152 Rear End and Same Direction Sideswipe = 35%
Five Percent Reporting Driving too fast for conditions = 45%
Listing of Crashes 06-0698
Using SPF and PSI Information in Phase I Creation of the 5% Report requires a look at 100% of sites. Weighting of PSI supports goal to reduce K’s and A’s Substantive safety measure at project level Breakdown by segments and intersections within the project
Using SPF and PSI Information in Phase I • Suggested triggers for Road Safety Assessment if: • PSI is 10 or higher • Segment or intersection in top 33% of its peer group • If segment or intersection has PSI 50% higher than adjacent similar location(s)
Quantitative Site Analysis Thru AADT = 2575 Stop AADT = 2650 Experience = 7 crashes in 5 years. (‘04 – ‘08) 1.4 crashes per year 1 Fatal Crash Recent PDO crash in 12/08, and A-Injury crash in 01/09 HSM: N spf 4ST = exp[-8.56 + 0.60xln(AADT maj ) + 0.61xln(AADTmin)] = 2.61 crashes/year (No night crashes) IDOT SPF: N K+I = exp(-8.05)*((AADT major)^0.674)*((AADT minor)^0.272) = 0.55 K+I crashes per 5 years. Is this intersection performing poorly?
Quantitative Site Analysis • Countermeasures Completed • Lighting • Improve sight distance (hedge clearing) • Relocated utility sign • Countermeasures Under Consideration • Improved warning signs • Police private signs on ROW
Quantitative Site Analysis Thru AADT = 2300 Stop AADT = 650 Experience = 10 crashes in 5 years. (‘04 – ‘08) 2.0 crashes per year 1 Fatal Crash 3 A-Injury Crashes 2B-Injury Crashes HSM: N spf 4ST = exp[-8.56 + 0.60xln(AADT maj ) + 0.61xln(AADTmin)] = 1.04 crashes/year IDOT SPF: N K+I = exp(-8.05)*((AADT major)^0.674)*((AADT minor)^0.272) = 0.34 K+I crashes per 5 years. Is this intersection performing poorly?
Quantitative Site Analysis • Countermeasures Completed • Removed trees in sight triangle Countermeasures Under Consideration • Improved warning signs • Police private signs on ROW • Lighting • Overall – Quantitative analysis supports actions taken, and informs future decisions.
Summary • SPF/PSI Products Support • Identification of safety opportunities • IDOT goal to reduce K’s and A’s • Office review of 5% locations • Focus of resources to best effect • Credibility of analysis • SPF/PSI Products will Support • SafetyAnalyst • Highway Safety Manual