Download
1 / 42
420 likes | 752 Views
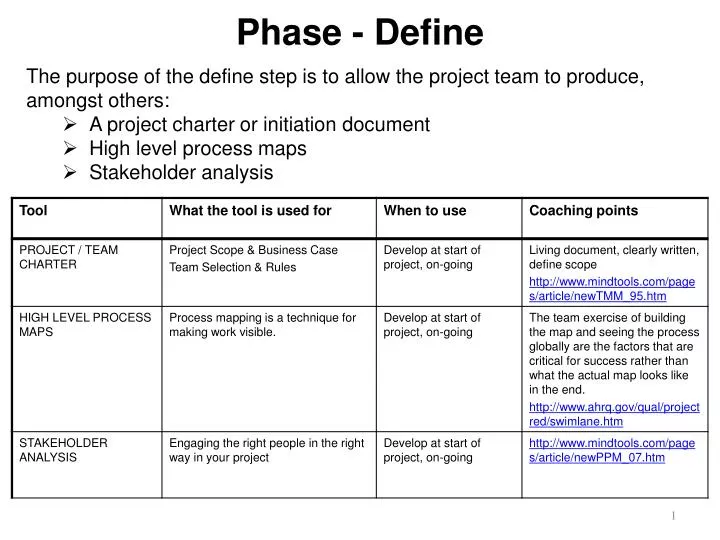
Phase - Define. The purpose of the define step is to allow the project team to produce, amongst others: A project charter or initiation document High level process maps Stakeholder analysis. Phase - Define. Phase - Define. Phase - Define. Phase - Measure.

E N D
Phase - Define • The purpose of the define step is to allow the project team to produce, amongst others: • A project charter or initiation document • High level process maps • Stakeholder analysis
Phase - Measure • Measure is the heart of what makes Lean Six Sigma work: • Evaluate the existing measurement system • Improving it is necessary • Developing a measurement system if you don’t already have one • Observe the process • Gather Data • Map the process in more depth
Phase - Analyze • The purpose of the Analyze phase is to make sense of all the information and data collected: • Use data to confirm source of delays, waste, and poor quality • Biggest challenge is to “stick to the data” • Avoid using experience and opinions about the root cause of problems • Look for patterns in the data
Phase - Improve • The purpose of Improve: is to make recommendations for changes in a process that will eliminate the defects, waste, costs, etc… • Linked to the customer • Use creativity • Review existing “best practices”
Phase - Control • The purpose of Control: is to make sure that any gains will last. • Document the new, improved procedures • Train everyone involved • Set up procedures for tracking key “vital signs” • Hand-off ongoing management to the Process Owner • Complete Project documentation • Put measures in place to prevent “back sliding”
Phase – Control 5.1 Pilot Plan
Phase – Control 5.1 Pilot Plan
Phase – Control 5.2 Plan & Implement
Phase – Control 5.3 Process Integration
Phase – Control 5.3 Process Integration
Phase – Control 5.4 Specialty Control Charts
Phase – Control 5.5 Closure and Recognition
7 Basic Tools • The designation arose in postwar Japan, inspired by the seven famous weapons of Benkei. At that time, companies that had set about training their workforces in statistical quality control found that the complexity of the subject intimidated the vast majority of their workers and scaled back training to focus primarily on simpler methods which suffice for most quality-related issues. • The Seven Basic Tools stand in contrast to more advanced statistical methods such as survey sampling, acceptance sampling, statistical hypothesis testing, design of experiments, multivariate analysis, and various methods developed in the field of operations research. The seven tools are: • Cause-and-effect (also known as the "fish-bone" or Ishikawa) diagram • Check sheet • Control chart • Histogram • Pareto chart • Scatter diagram • Stratification (alternately, flow chart or run chart)
Resources • http://www.khanacademy.org/ • Statistics Handbook • http://davidmlane.com/hyperstat/index.html • http://www.statsoft.com/textbook/elementary-concepts-in-statistics/?button=1 • http://onlinestatbook.com/version_1.html • http://lib.stat.cmu.edu/ • http://www.strategosinc.com/human_side.htm • http://ocw.mit.edu/index.htm (search Lean Six Sigma) • http://www.moresteam.com/toolbox/index.cfm • http://www.moresteam.com/resources/lean.cfm • http://www.itl.nist.gov/div898/handbook/quantgal.htm • http://www.leansixsigmahpo.com/tools.html • http://www.skymark.com/resources/refhome.asp • http://www.strategosinc.com/value_stream_vs_process_mapping.htm • http://www.freeleansite.com/ • http://www.dmaictools.com/ • http://www.statpac.org/research-library/ • http://www.accountability.wa.gov/leadership/lean/default.asp • http://www.gembutsu.com/lean_faq.html • http://leanyourcompany.com/improve/What-are-the-seven-wastes.asp • http://www.micquality.com/six_sigma_glossary/process_improvement_tools.htm