Download
1 / 30
330 likes | 820 Views
ANALISIS YANG DIGUNAKAN. Net Present value (NPV) Net Benefit Cost Ratio (Net B/C) Gross Benefit Cost Ratio (Gross B/C) Internal Rate of Return (IRR) Profitability Ratio (PR ) Pay Back Period Average Rate of Return Break Even Point (BEP). 1. Net Present Value (NPV).

E N D
ANALISIS YANG DIGUNAKAN Net Present value (NPV) Net Benefit Cost Ratio (Net B/C) Gross Benefit Cost Ratio (Gross B/C) Internal Rate of Return (IRR) Profitability Ratio (PR ) Pay Back Period Average Rate of Return Break Even Point (BEP)
1. Net Present Value (NPV) • Merupakan net benefit yang telah didiskon dengan menggunakan Social opportunity cost of capital sebagai diskon faktor 1 • Discount factor (df) = (1 + i)t dimana : i = tingkat bunga t = tahun
n NPV = ∑ NBt (1+i)-t t=1 Atau n NPV = ∑ - t =1 dimana : NB = Net benefit = Benefit-Cost Bt = Benefit yang telah di-discount Ct = Cost yang telah di-discount (Biaya Investasi +biaya Operasi) i = Discont fakor/tingkat bunga t = Tahun (waktu) Bt (1+i)t Ct (1+i)t
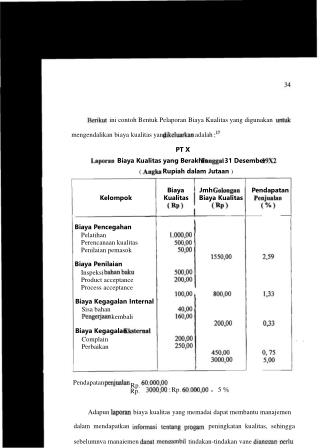
Jika : NPV ≥ 0 go (feasible) NPV = 0 go BEP (TR=TC) NPV > 0 go NPV < 0 tidak layak untuk dilaksanakan Contoh: Untuk usaha budiaya ikan di kolam diutuhkan dana sebesar 35 juta yang dialokasikan selama 2 tahun, persiapan tahun pertama Rp 20 juta dan tahun berikutnya Rp 15 juta, usaha mulai operasional 2 tahun setelah kontruksi ,sedangkan biaya pemeliharaan dan operasi Rp 5 juta pertahun, pada tahun ke 2 dengan penghasilan sebesar Rp 10 juta dan seterusnya cash in flow dapat dilihat pada tabel dibawah,sedangkan discount factor/ tingkat bunga yang berlaku adalah 18 %
∑ t =1 n PNV = NBt (1+i)-t =Rp. 11.115.730,- NPV > 0berarti rencana usaha tersebut layak untuk diusahakan
2. Net Benefit Cost Ratio Net B/C Pebandingan adalah perbandigan antara net benefit yang telah di-discount bernilai positip dengan net benefit yang telah di-dicount bernilai negatip Formula sbb: Net B/C = n ∑ NBt (+) t = 1 n ∑NBt (-) t =1
Dari Contoh Tersebut di atas maka : Net B/C = (df.18%) = 1,339 43.826 32.713
3. Gross Benefit Cost Ratio Gross B/C adalah perbandingan antara secara keseluruhan benefit kotor yang telah di- discount dengan keseluruhan Cost yang telah di-discout dengan tingkat bunga yang berlaku Gross B/C = ∑ Bt (1+ i)-t n ∑Ct(1 + i)-t t =1 n t=1
Dari contoh diatas maka : Gross B/C = (df.18%) = 1,1917 = 1,19 69.080 57.966
4. Metode Internal Rate of Return Tingkat bunga nilai sekarang suatu investasi dengan nilai sekarang penerimaan kas bersih dimasa mendatang Atau IRRadalah suatu discount rate yang menghasilkan NPV (Net Present Value) sama dengan 0 (nol) Berarti : IRR > Sosial Opportunity Cost of Capital (SOCC) usaha tersebut feasible IRR = SOCC Pulang pokok IRR < SOCC Usaha tidak feasible Catatan : SOCC = Discount factor (df)
LANGKAH CARA MENENTUKAN IRR • Mencoba Menghitung NPV1 pada df yang berlaku. msl. Positip • Melanjutkan menghitung NPV2 dengan df (discount rate) masih positif, maka dilanjutkan menghitung NPV dengan df lebih tinggi, sampai dengan NPV3yang diperoleh adalah Negatip • Setelah mendapatkan NPV1 positip dan NPV3 negatip maka IRR dihitung dengan menggunakan interpolasi rumus sbb:
FORMULA IRR = i1 + Dimana : i1 = tingkat discount rate NPV1 (+) i3 = tingkat discount rate NPV3 (-) NPV1 ( NPV1 - NPV 3) x ( i2 - i1)
Dari Formula Di atas: IRR = 0,18 + x (0,24 – 0,180) = 0,23974 = 23,97 % 11.115 (11.145 + 48.84)
Grafik Hubungangan IRR dengan NPV NPV NPV=11.114 23,97% i=24% NPV=0 18% NPV=-48 IRR
ANALISIS FINANSIAL USAHA PENANGKAPAN IKAN (GILL NET) Total NPV Positif (df.12%) : Rp 29.650.072,- Total NPV Negatif (tahun 0) : Rp 22.600.000,- NPV (df.12%) : Rp 7.050.720,- Net B/C (df.12%) : 1,312 IRR : 33,5 % IRR > Social Discount Rate (12%)
5. Profitability Ratio (PR) Profitability ratio Merupakan suatu ratio perbandingan antara selisih benefit dengan biaya dibandingkan dengan jumlah investasi yang semunya telah di-discount denga tingkat bunga yang berlaku PR = n n ∑ Bi - ∑ Ci ∑ Ii i=1 i=1 n n n=1
69.078 – 25253 32.713 Profitability Ratio (PR) = = 1,3397 = 1,34
6. PAY BACK PERIOD Pay Back Period (PBP) Jangka waktu tertentu yang menunjukkan terjadi arus penerimaan ( cash in flow ) secara kumulatif sama dengan jumlah investasi dalam bentuk present value Untuk mengetahui berapa lama usaha/proyek yang dikerjakan baru dapat mengembalikan investasi Msl; Masa penggantian alat lama dengan alat baru yang mempunyai produktivitas dan mutu produk baik
n n ∑ Ii - ∑ Bisp-1 i=1 Formula : PBP = Tp-1 + Dimana : PBP = Pay Back Period Tp-1 = Tahun sebelum terdapat PBP Ii = Jumlah investasi yang telah di-discount Bisp= Jumlah benefit yang telah di-discount sebelum PBP Bp = Jumlah benefit pada PBP berada i=1 Bp
Biaya total Hitungan Cara cepat PBP ( Pay Back Period) = = = 5,21 th atau = 5 th , 2 bln, 17 hari Jumlah keuntunan 57966 11114
n n ∑ Ii - ∑ Bisp-1 i=1 i=1 Bp PBP = Tp-1 + Dimana : PBP = Pay Back Period Tp-1 = Tahun sebelum terdapat PBP Ii = Jumlah investasi yang telah di-discount Bisp = Jumlah benefit yang telah di-discount sebelum PBP Bp = Jumlah benefit pada PBP berada • PBP = 5 + = 5 + 0,4596 = 5 tahun 5 bulan 15 hari Bisp-1 = (7.182 +7.303+7.221+7.431) = 29.137 (tabel Slide 23) 32.712 -29.137 7.779
ANALISA BREAKEVEN Asumsi : 1. Harus ada biaya tetap dan variabel 2. Biaya tetap konstan dan biaya variabel tetap perunit 3. Harga jual tetap utk perunit 4. Memproduksi/menjual satu jenis produk Barang campuran dianggap satu jenis produk 5. Semua barang yang diproduksi habis terjual
RUMUS Penjualan BEP = Kuantita BEP = HPU : harga perunit BEP Harga = FC P - AVC ,atau Total biaya (TC) Total produksi (Y)
Contoh dari tabel diatas: 22713 BEP = = 1 – 0,510 = 46353 1 – 35253/69080 22713
7. Metode Average rate of Return Average rate of ReturnTingkat keuntungan rate yang diperoleh dari satu investasi • Laba setelah pajak dibandingkan dengan investasi dalan satuan persen (%) • Misal: Biaya tetap = Rp 800 jt umur teknis 8 bulan Biaya modal kerja = Rp 200 jt Pendapatan kotor = Rp 1.500 jt/th Biaya operasional = Rp 1.000 jt/th Pajak 35%
Pendapatan kotor = 1500 jt • Biaya-biaya : Operasional = 1000 jt Penyusutan(800jt) = 100 jt 1100 jt Laba sebelum pajak= 400 jt Pajak (35% x 400 jt) = 140 jt Laba setelah pajak 246 jt Maka: Rate of return = x 100% = 26 % 260 jt 1000 jt


![Kertas Yang Digunakan Untuk Membuat Undangan Gulung 0818_0771_6413[wa]](https://cdn4.slideserve.com/9747589/kertas-yang-digunakan-untuk-membuat-undangan-dt.jpg)