Download
1 / 2
20 likes | 87 Views
Supplemental Figure 1 Comparison of PFGE Results by characterization of MRSA isolate. A = Invasive Disease-Associated (N=37) B = Non-Invasive Disease-Associated (N=111) C = Colonization Strains (N=55) D = Colonization Strains two years later (N=50).

E N D
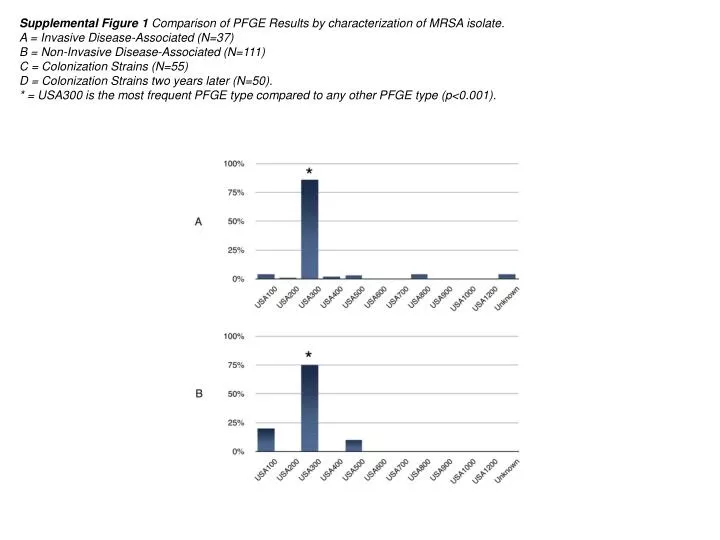
Supplemental Figure 1 Comparison of PFGE Results by characterization of MRSA isolate. A = Invasive Disease-Associated (N=37) B = Non-Invasive Disease-Associated (N=111) C = Colonization Strains (N=55) D = Colonization Strains two years later (N=50). * = USA300 is the most frequent PFGE type compared to any other PFGE type (p<0.001).