Download
1 / 16
200 likes | 465 Views
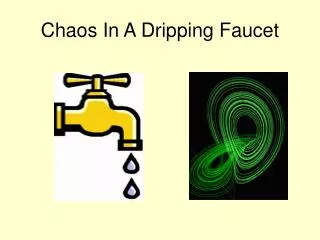
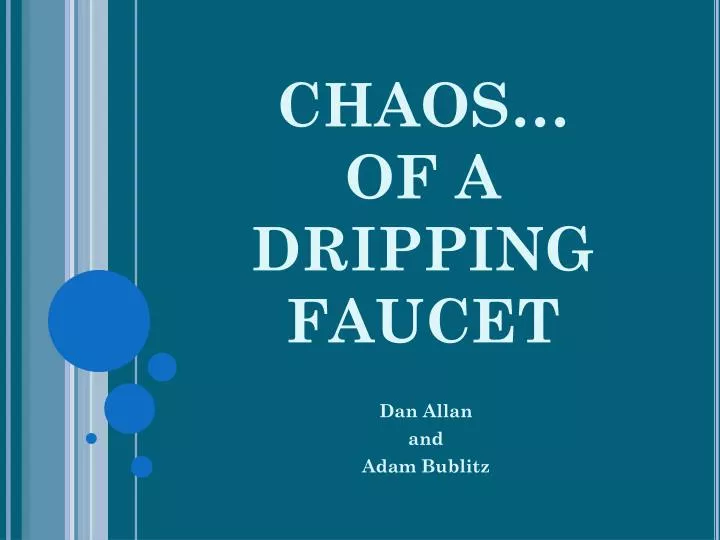
CHAOS… OF A DRIPPING FAUCET. Dan Allan and Adam Bublitz. Chaos. Dripping faucet is nonlinear dynamic system Drop influences initial conditions of faucet Affects next drop Therefore, increasing flow rate causes bifurcations Leads to chaos. Our Set-up. Water bucket acts as reservoir

E N D
CHAOS…OF A DRIPPING FAUCET Dan Allan and Adam Bublitz
Chaos • Dripping faucet is nonlinear dynamic system • Drop influences initial conditions of faucet • Affects next drop • Therefore, increasing flow rate causes bifurcations • Leads to chaos
Our Set-up • Water bucket acts as reservoir • Flow to dropper on stand • Through HeNe laser • Blocks beam aimed at detector • LabView writes data
Reconstruction, Phase 1 • Previous lab disrepair • Hoses leaked…very close to our electronics • Bought new hoses and fixtures • Rearranged • Computers and water are now as far apart as possible • Cleaned the equipment • Assembled a new set-up
MISSING DATA • Problem with our LabView program • Dropped seconds of data randomly • Changing clock speed of waveform minimizes data “drops” • Dove into the LabView code for experiment • Cannot eliminate completely or resolution suffers Default Clock Rate 700 Clock Rate 100 Clock Rate
Reconstruction, Phase 2 • Consequence of trying to fix missed data • rewrote the LabView vi • Old Code • count each smallest increment of time (1/1000 sec) the laser was blocked • only write to file after certain number of samples • not commented and hard to understand • New Code • commented • much shorter • writes differences of time (only important data)
Old Code New Code
DATA ANALYSIS: Sources of Error • Computer lag results in missed drops • Not every drop passes through the laser beam • Also had a problem with the drop rate “jumping” discretely (shown below) • thought to be most probably caused by our changing pressure in our reservoir
DROPPER A (1.9 mm)7.51 DROPS/SEC Logistic Map: Comparing Successive Drops The “Spectrum” of Drop Frequency Time(sec) # Drops Time(sec) Time(ms)
DROPPER A (1.9 mm)15.56 DROPS/SEC Logistic Map: Comparing Successive Drops The “Spectrum” of Drop Frequency Time(sec) # Drops Time(sec) Time(ms)
DROPPER A (1.9 mm)21.41 DROPS/SEC Logistic Map: Comparing Successive Drops The “Spectrum” of Drop Frequency Time(sec) # Drops Time(sec) Time(ms)
DROPPER B (0.45 mm)6.21 DROPS/SEC Logistic Map: Comparing Successive Drops The “Spectrum” of Drop Frequency Time(sec) # Drops Time(sec) Time(ms)
DROPPER B (0.45 mm)9.47 DROPS/SEC Logistic Map: Comparing Successive Drops The “Spectrum” of Drop Frequency Time(sec) # Drops Time(sec) Time(ms)
DROPPER B (0.45 mm)11.10 DROPS/SEC Logistic Map: Comparing Successive Drops The “Spectrum” of Drop Frequency Time(sec) # Drops Time(sec) Time(ms)
Dropper A (1.9 mm) Dropper B (0.45 mm)
SUGGESTIONS FOR FUTURE GROUPS • Take time to understand flow of our LabView code • We finally stopped the leaks on the second bucket • You can now have constant pressure in your reservoir • Find a way to make the laser, detector, and dropper stay aligned • Now that everything works well, take many data sets: varying water flow and dropper diameter