Download
1 / 15
150 likes | 237 Views
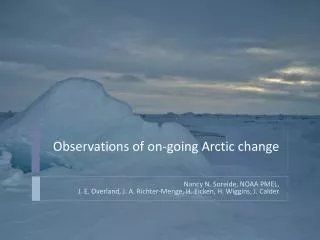
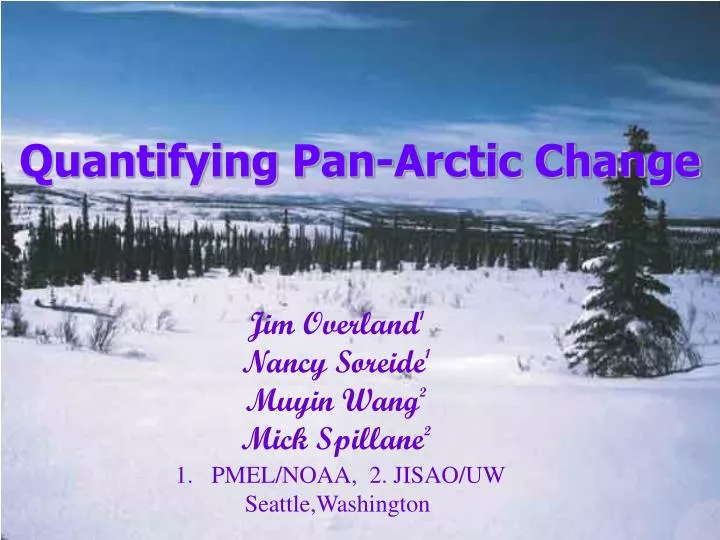
Quantifying Pan-Arctic Change. Jim Overland 1 Nancy Soreide 1 Muyin Wang 2 Mick Spillane 2. PMEL/NOAA, 2. JISAO/UW Seattle,Washington. Arctic Annual Temperature.

E N D
Quantifying Pan-Arctic Change Jim Overland1 Nancy Soreide1 Muyin Wang2 Mick Spillane2 • PMEL/NOAA, 2. JISAO/UW • Seattle,Washington
Arctic Annual Temperature Reconstructed annual temperature (green) for arctic zone: 65-90N using tree-ring width data from 12 sites near circumpolar treeline and three sites at northern, elevational treeline. By G. Jacoby, Lamont-Doherty Earth Observatory Composite time series of surface air temperature anomalies relative to 1961-90 for the region poleward of 62oN. By I. Polyakov, IARC.
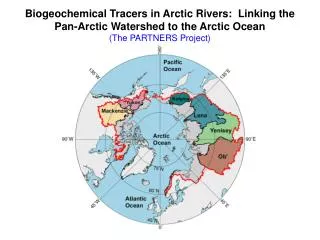
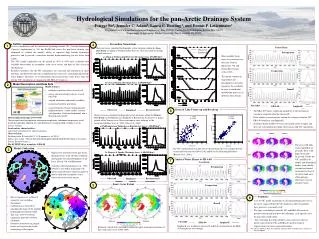
Sea Ice Area Arctic Sea Level Pressure Barents Sea Cod Growing Seasons Greenland Shrimp Spring Alaska Temperature Winter Europe Temperatures N. American Caribou Norway Deer Permafrost temperature Stratosphere Temperature Marine mammals Snow Area Tundra Area Atlantic Water in Arctic ARCTIC CHANGES OVER THE LAST 35 YEARS
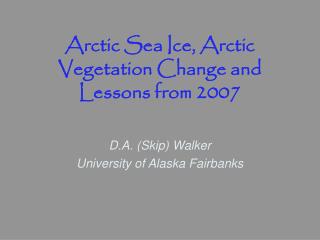
Index of Persistence of the Greening Trend North of 30oN for the Period 1982-99 Zhou L., et al, 1999: J. Geo. Res., Climate and Vegetation Research Group, Boston University
Monthly Mean Temperature Anomalies for March During 1990s at 200 hPa based on TOVS Path-P dataset
Difference In Daily Mean Surface Temperature Anomalies winters) (AO) Thompson, et al. 2001
Vorticity Index Global Mean SAT Anomaly Polyakov & Johnson,2000 Stott, 2001 Ice Anomaly Venegas & Mysak, 2000 CHANGE DETECTION
Wintertime Aleutian Low Sea Level Pressure 50 year cycle plus “long memory-multiprocess” behavior
Coccolithophorid Bloom on the Eastern Bering Sea Shelf During the Anomalous Summer of 1997
Gulf of Alaska Climate Indices and Shrimp-Trawl Catches (Biomass) (Anderson and Piatt, 1999) NPPI BC Coastal SST Normalized Anomaly GOA Air Temp GOA Water Temp 250m 1.0 0.8 0.6 Proportion of total catch 0.4 0.2 0.0 1956 1953 1959 1962 1965 1968 1971 1974 1977 1980 1983 1986 1989 1992 1995 Shrimp Gadid Flatfish Other
CONCLUSIONS • Large Arctic temperature changes over last 100-300 years • Need change detection protocol • Strong covariability of atmosphere/sea-ice/terrestrial/biology over last 35 years • CHANGE DETECTION: Use multivariate analysis but based on biocomplexity (nonlinear) concepts