Download
1 / 82
910 likes | 1.51k Views
Species diversity. Ecological communities differ in species number and composition tropics > temperate remote islands < large islands continents > islands. Species diversity. Comprised of species richness : number of species present heterogeneity of species equitability or evenness

E N D
Species diversity • Ecological communities differ in species number and composition • tropics > temperate • remote islands < large islands • continents > islands
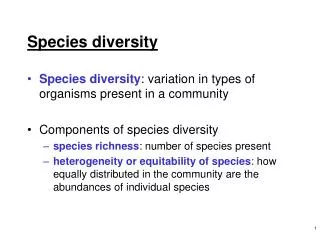
Species diversity • Comprised of • species richness: number of species present • heterogeneity of species • equitability or evenness • relative abundance of each species present in the community
Measurement of species diversity • Species richness • number of species present in community • first and oldest concept of diversity • simplest estimate of diversity • only residents are counted • treats common and rare species with the same weight
Measurement of species diversity • Heterogeneity of species • uses relative abundance to give more weight to common species • possibilities in a 2-species community: Comm 1Comm 2 Species A 99 50 Species B 150 100 100
Measurement of species diversity • Shannon-Wiener diversity function H' = - (pi) [ln(pi)] H’ = Shannon-Wiener index of species diversity s = number of species in community pi = proportion of total abundance represented by ith species s
Measurement of species diversity • Shannon-Wiener diversity function • values range from near zero to ??? • increased values indicate increased diversity • index has no units; value only as comparison between at least two communities
Species diversity • What increases species diversity (H’)? • increasing the number of species in the community (s) • increasing the equitability of the abundances of each species in the community
Evenness • Measurement of equitability among species in the community • Pielou evenness E = H’ / Hmax E = Pielou evenness H’ = calculated Shannon-Wiener diversity Hmax = ln(s) [species diversity under maximum equitability conditions] • values range from near zero to 1
Commonness, rarity and dominance • Preston’s log normal distribution model • a few common species with high abundances • many rare species with low abundances
Commonness, rarity and dominance • MacArthur’s broken stick model • random breaks in a stick log normal distribution of pieces • results in a few large pieces and many small pieces
Commonness, rarity and dominance • Community organization • model 1 • a few very common species • many rare species • model 2 • a few very common and very rare species • most species of intermediate abundance
Fig. 22.1, p. 435: Relative abundance of Lepidoptera captured in a light trap in England (6814 individuals representing 197 species).
Biogeography • Observations of relationships between • area and number of species • distance from source • Island biogeography • E.O. Wilson and Robert MacArthur
Island biogeography • Island communities: well-defined, captive • Variables • size • degree of remoteness • elevation • Simple community structure • Increase in area increase in number of species
Island biogeography • Habitats considered as “insular” because they are isolated from other communities • caves • mountain tops • some peninsulas • wildlife or game preserves
Fig. 24.14, p. 502: Number of land-plant species on the Galapagos Islands in relation to the area of the island.
Fig. 24.15, p. 503: Species-area curve for amphibians and reptiles of the West Indies.
Island biogeography • Relationship between remoteness and number of species • increase distance from mainland decrease number of species • number of species present is dependent on immigration from mainland • rate is a function of the number of species already present on the island • number of species present = balance between immigration and extinction
Fig. 24.17, p. 504: Equilibrium model for biota on a single island.
Fig. 24.18, p. 504: Equilibrium model for biota on several islands of different size and remoteness.
Island biogeography • Small species are found on more islands than are large species • Number of herbivore species > carnivores • Number of generalist herbivore species > specialist herbivores
Island biogeography • Species:area relationship • log : log relationship • 10-fold decrease in area 50% decrease in number of species
Island biogeography • Species:area relationship
Latitudinal diversity gradients • Abundance and diversity patterns • latitude • elevation • mountainsides • peninsulas
Fig. 22.5, p. 438: Number of tree species in Canada and U.S.
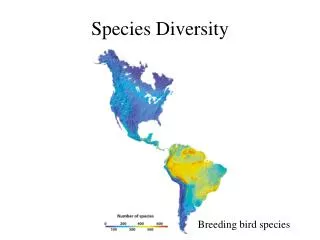
Fig. 22.6, p. 439: Number of species of land birds in North and Central America.
Fig. 22.7, p. 440: Number of species of calanoid copepods in top 50 m of transect from tropical Pacific to Arctic Ocean.
Fig. 22.9, p. 440: Number of species of mammals in continental North America.
Fig. 22.10, p. 440: Species richness of mammals in North and South America in relation to latitude.
Tree species Malaysia (4 acres): 227 Michigan (4 acres): <15 Ant species Brazil: 222 Trinidad: 134 Cuba: 101 Utah: 63 Alaska: 7 Latitudinal diversity gradients
Snake species Mexico: 293 U.S.: 126 Canada: 22 Fish species Amazon R: >1000 Central American rivers: 450 Great Lakes: 172 Latitudinal diversity gradients
Latitudinal gradient hypotheses • History (time) • Spatial heterogeneity • Competition • Predation • Productivity • Environmental stability (climate) • Disturbance
Latitudinal gradient hypotheses • History (time) hypothesis • tropical habitats older, more stable • support for • geological past of temperate less constant than tropics due to glaciation • all communities diversify with time • argument against • as glaciers moved in, species moved south to escape • history hypothesis can not be tested
Latitudinal gradient hypotheses • Spatial heterogeneity hypothesis • higher diversity in tropics due to increase in number of potential habitats • environmental complexity moving away from equator • macro level: e.g., topographic features • micro level: e.g., particle size, vegetation complexity
Latitudinal gradient hypotheses • Spatial heterogeneity hypothesis • Hutchinson’s n-dimensional niche specialization • types of diversity defined by spatial heterogeneity • within-habitats ( diversity) • between-habitats ( diversity)
Latitudinal gradient hypotheses • Competition hypothesis • less competition in temperate and polar environments compared to tropics because these populations are more regulated by extreme environmental conditions than by biological factors • populations maintained <K due to weather, etc. and major sources of mortality are abiotic • since population sizes small, decreased competition for resources
Latitudinal gradient hypotheses • Competition hypothesis • no weather extremes in tropics, populations can increase to densities at which competition for resources is necessary • promotes species diversity through specialization resource partitioning • and diversity higher in tropics due to organisms being more specialized to habitats
Fig. 22.14a, p. 447. Niche breadth versus niche overlap determined by competition within the community.
Latitudinal gradient hypotheses • Predation hypothesis • increased species diversity in tropics is function of increased number of predators that regulate the prey species at low densities • decreases competition among prey species • allows coexistence of prey species and potential for new additions
Fig. 22.16, p. 449. Janzen-Connell model for increased diversity of tropical rainforest trees: seed predation versus distance of seed from tree versus seed survival.
Latitudinal gradient hypotheses • Predation hypothesis • there is more selective pressure on prey evolving avoidance mechanisms than in becoming better competitors • cropping principle • remove predators and prey start competing • predation increases diversity by reducing intraspecific competition among prey species
Community anchored by keystone starfish Heliaster in northern Gulf of California.