Download
1 / 79
790 likes | 937 Views
Successful Implementation of RtI at the Secondary Level: Strategies and Solutions Learned. Presented by Sara Johnson, Assistant Principal Dave Ertl, Principal Chisago Lakes High School Holly Windram, Asst. Special Education Director SCRED March 26, 2009. Introductions.

E N D
Successful Implementation of RtI at the Secondary Level: Strategies and Solutions Learned Presented by Sara Johnson, Assistant Principal Dave Ertl, Principal Chisago Lakes High School Holly Windram, Asst. Special Education Director SCRED March 26, 2009
Get ready for the journey Windram & Johnson, 2008
A Three-Tier Model • Intensive, Individual Interventions • Individual Students • Assessment-based • High Intensity • Of longer duration • Targeted Group Interventions • Some students (at-risk) • High efficiency • Rapid response • Targeted Group Interventions • Some students (at-risk) • High efficiency • Rapid response • Universal Interventions • All students • Preventive, proactive • Universal Interventions • All settings, all students • Preventive, proactive 75-85% 75-85% School-Wide Systems for Student Success Academic Systems RtI Behavior Systems PBIS • Intensive, Individual Interventions • Individual Students • Assessment-based • Intense, durable procedures 5-10% Tier 3 5-10% Tier 2 10-15% 10-15% Tier 1
SCRED RtI Model: Academics and Social/Emotional/Behavior Tier 3: Some Assessment Tier 2: Few Instruction Tier 1: All Problem-Solving & Organization
Why RtI at the Secondary Level? “Shouldn’t all the Special Ed kids be identified already?” “I’m here to teach the kids who show up to learn.” “I have to get through my content and you want me to teach [insert 1 million other things here]” “Won’t I have to do more work?” “How is this relevant to me - today - right now?” “It’s just another initiative.” “When is lunch?” “Is this workshop over yet?”
Why RtI at the Secondary Level • NCLB • IDEA 2004 • Prevention We need more options
Traditional Model Special Education General Education Amount of Resources Needed To Benefit Sea of kids in the “gray” area Severity of Educational Need or Problem
New System of Problem Solving Special Education General Education Amount of Resources Needed To Benefit General Education with Support Severity of Educational Need or Problem
Bridging the Gap Core + Intensive Core + Supplemental Weekly Core Amount of Resources Needed To Benefit Weekly-Monthly 3x/year Severity of Educational Need or Problem
Chisago Lakes High School • 1200 students • 10% special education • 8% free/reduced lunch • 1% English Language Learning • Four, 85 minute blocks • 98% graduation rate • Credit increase: 29 by 2009-10 Windram & Johnson, 2008
02-03 School Year:Catalyst for Change • Incoming 9th graders. • Top concerns: academic skills, social interactions, and work completion issues Sound familiar? Windram & Johnson, 2008
Ninth grade “If you want to reshape high school, start by changing ninth grade.” “. . . success or failure in ninth grade is a pivotal indicator of whether or not a student drops out.”
Timeline Year 1 (03-04): Problem-Solving Team and Process Year 2 (04-05): Intervention Integrity and STP Intervention development Year 3 (05-06): RtI English 9 class Year 4 (06-07): RtI English 10, CLHS “Check & Connect” Year 5 (07-08): See table Windram & Johnson, 2008
CLHS Three Tier RtI Model: Examples Windram & Johnson, 2008
Timeline for decision-making Start with DATA
CLHS: Problem Solving • Student Assistance Team (Regular Education) = Problem-Solving Team • Problem-Solving Team Members: Assistant Principal, guidance counselors, school psychologist, school nurse, police liaison officer, truancy prevention, chemical health, and mental health. • Weekly, Monday AM • 1x month data reviews with small group: AP, Counselors, School Psych., truancy, RtI Coach Windram & Johnson, 2008
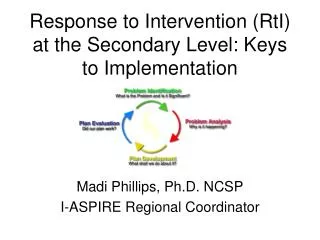
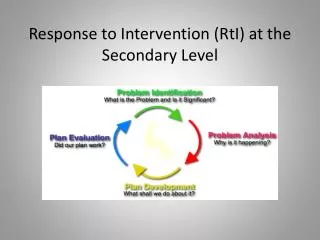
SCRED Problem-Solving Model 2. Problem Analysis Why is the problem occurring? 1. Problem Identification What is the discrepancy between what is expected and what is occurring? 3. Plan Development What is the goal? What is the intervention plan to address this goal? How will progress be monitored? 5. Plan Evaluation Is the intervention plan effective? 4. Plan Implementation How will implementation integrity be ensured?
Problem-Solving Process at CLHS Step 1: Student referred to SAT/Problem-Solving Team via counselors from teachers, parents, etc. Step 2: Problem Identification data are collected Step 3: Team prioritizes problem & decides next step: • Level 1: Grade Level Team or Consultation/follow-up • Level 2: Support Staff Consultation • Level 3: Refer for STP • Level 4: Extended Problem-Solving Team referral • Refer to SST for consideration of SE evaluation Windram & Johnson, 2008
Who collects the data? Windram & Johnson, 2008
Data Reviews • RtI students and Alt English and Math: 2x per term • Teachers identify students of concern prior to meeting • Graph review and problem-solving done as a team • RtI Teachers, Principal, Asst. Principal, 1 or more counselors, School Psychologist • 1x month for students in Problem-Solving • CBM graphs • Check & Connect data Windram & Johnson, 2008
RtI English classes • Daily, one 85 minute block, all year • DOUBLE the instructional time!!!! • Typical English 9 & 10: 1 block, 1 semester • Reading & writing interventions 30-40 min. daily • Core English 9 & 10 curriculum taught • Modified pace • Adapted based on students’ needs • CBM Reading & Writing data collected on every student • Data reviews 2x per quarter Windram & Johnson, 2008
Critical features of remedial literacy instruction at the secondary level • Effective professional development • Effective instructional tools incl. core curriculum and instructional methodology • System reorganization and support • Formative and summative assessment • Building/classroom climate that fosters high student engagement • Committee/Team (e.g., Allain, 2008; Alliance for Excellence in Education, 2004; Diamond, 2004)
Who are the teachers • English Teachers: Enthusiastic, experience with “at-risk” learners • Intervention Specialists • These were already existing positions Windram & Johnson, 2008
How Students Are Selected RtI Eng 9 • Spring of 8th grade, teachers introduce class to students and families • Not required • About 18-24 students per year Windram & Johnson, 2008
How students are selected Multiple data sources and indicators of student engagement: • CBM scores • MAPs • State level reading tests • Attendance and grades • Current 8th grade class enrollment • 8th grade problem-solving status • Eighth grade teacher input and recommendation • No specific/formal entrance or exit criteria Windram & Johnson, 2008
RtI English 9: First quarter • Three goals: • Build relationships with students • Establish regular cycle of CBM data collection & review. Set up graphs. • Apply problem-solving model for intervention decisions: what and for whom • Professional Development Windram & Johnson, 2008
First quarter supplemental instruction Whole group academic interventions for reading fluency and writing mechanics • Daily Oral Language (DOL) • Six Minute Solution (Adams & Brown, 2003) • Peer tutoring, reading fluency building intervention. • Same-level pairs, students engage in repeated readings of 1-minute nonfiction passages as their partners note the number of words read correctly. Windram & Johnson, 2008
RtI English Classes • End of first quarter: Identify additional needs at class, small group, and individual level. • Rest of the year: • On-going data collection and reviews • Problem-solving for class, small group, and individual level • Adapt supplemental instruction for basic reading and writing skills based on student need Windram & Johnson, 2008
PLC Goal: RtI Eng 9 • Increase class average ORF through a motivation intervention (i.e. one on one graph reviews). • October 2009: Average was 125.35 wrc • By June 2009: Average of 140.35 wrc • February 2009: Average was 142.23 wrc Avg growth was 1.13 wrc per week* * 15 words in 17 weeks. Winter break weeks not included.
SCRED Target Scores CBM ORF: 170 words read correct CBM Correct Word Sequences: 64 MAP R RIT: 226 MAP M RIT: 235 – Algebra I
What happened here? 2007-2008 2005-2006 2006-2007
Special Education: SLD SCRED districts use a SRBI process for SLD eligibility. CLHS: 05-06: 1 student 06-07: 1 student 07-08: 0 students
Other Tier 2 Programming • Interventions with certified staff • Master schedule for interventions • Resource Room support staff progress monitoring • CLHS “Check & Connect” at two levels: • Correctives (Tier 1 & 2) • CLHS “Check & Connect” = modified Check & Connect (http://ies.ed.gov/ncee/wwc/reports/dropout/check_conn/index.asp; Christianson, et al.) and Behavior Education Program (Crone et al., 2004) Windram & Johnson, 2008
Program Failure Rates Windram & Johnson, 2008
Program Referral Rates Windram & Johnson, 2008
What is the influence on schoolwide outcomes ???? Windram & Johnson, 2008
Chisago Lakes Middle School • 816 students • 10% special education • 15% free/reduced lunch • 1% English Language Learning • Seven period day • Daily homeroom - CORE Connect Windram & Johnson, 2008
CLMS Three Tier RtI Model: Examples Windram & Johnson, 2008