Download
1 / 82
840 likes | 1.11k Views
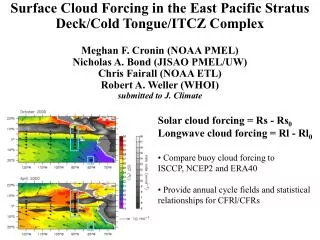
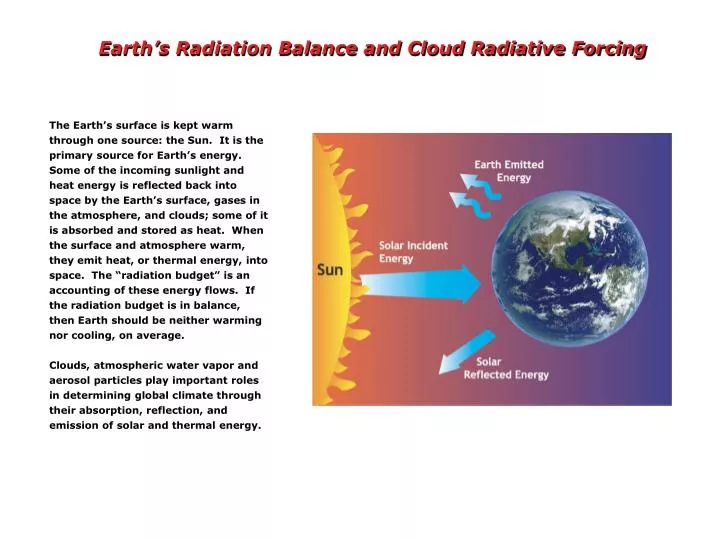
Earth’s Radiation Balance and Cloud Radiative Forcing.

E N D
Earth’s Radiation Balance and Cloud Radiative Forcing The Earth’s surface is kept warm through one source: the Sun. It is the primary source for Earth’s energy. Some of the incoming sunlight and heat energy is reflected back into space by the Earth’s surface, gases in the atmosphere, and clouds; some of it is absorbed and stored as heat. When the surface and atmosphere warm, they emit heat, or thermal energy, into space. The “radiation budget” is an accounting of these energy flows. If the radiation budget is in balance, then Earth should be neither warming nor cooling, on average. Clouds, atmospheric water vapor and aerosol particles play important roles in determining global climate through their absorption, reflection, and emission of solar and thermal energy.
Solar Constant measured by satellites at TOA 11-yr solar cycle
How does the Earth Respond? Earth System Response Forces Acting On the Earth System IMPACTS Feedback Of the total forcing of the climate system, 40% is due to the direct effect of greenhouse gases and aerosols, and 60% is from feedback effects, such as increasing concentrations of water vapor as temperature rises.
Major Climate System Elements Carbon Cycle Water & Energy Cycle Coupled Chaotic Nonlinear Atmosphere and Ocean Dynamics Atmospheric Chemistry
Radiative Forcing from 1750 to 2000 Anthropogenic Forcings IPCC, 2001
Human Influence on Climate Carbon Dioxide Trends: 100yr lifetime Methane Trends Sulfate Trends Global Temperature Trends From M. Prather University of California at Irvine
Daily mean solar flux at TOA • The Sun is closest to the Earth in Jan. So more solar energy received in SH than in NH. • At the equinoxes, the solar insolation is at a Max at the equator and is zero at the poles. • At the SS of NH, daily solar insolation reaches a Max at NP. At the WS of NH, the Sun • does not rise above north of about 66.5o, where solar insolation is zero.
Top-of-Atmosphere Radiation Budget (Incoming Solar = Outgoing Longwave) A = Planetary Albedo S0 = Solar Irradiance Te = Earth Radiative Temperature Ts = Equilibrium Surface Temperature 1% relative error in A 1 W m-2 flux error 0.5C error in Ts 2xCO2 => +4 W m-2
The Greenhouse Effect Solar Radiation Longwave Radiation
Clouds have been classified as the highest priority in climate change by the U.S. climate change research initiative because they are one of the largest sources of uncertainty in predicting potential future climate change
Cloud Radiative Forcing The effect of clouds on the Earth's radiation balance is measured as the difference between clear-sky and all-sky radiation results FX(cloud) = FX(clear) – FX(all-sky) FNet(cloud) = FSW(cloud) + FLW(cloud) where X= SW or LW Negative FNet(cloud) => Clouds have a cooling effect on Climate Positive FNet(cloud) => Clouds have a warming effect on Climate
Cloud Radiative Forcing (CRF) Since cloud-base temperature is typically greater than the clear-sky effective atmospheric radiating temperature, CRFLW is generally positive. The magnititude of CRFLW is strongly dependent on cloud-base height (i.e., cloud-base temperature) and emissivity. Conversely, clouds reflect more insolation than clear sky, therefore, CRFSW is always negative over long time averages or large spatial domains. The magnititude of CRFSW cooling strongly depends on the cloud optical properties and fraction, and varies with season.
235 W m-2 265 W m-2 57 W m-2 342 W m-2 107 W m-2 342 W m-2 285 W m-2 235 W m-2 Earth (With Clouds) Earth (No Clouds) FSW (cloud)=-50 W m-2 FLW (cloud)= 30 W m-2 => Net Effect of Clouds = -20 W m-2
CERES Data Processing Flow CERES Data 6 Months 6 Months 6 Months 6 Months CERES Calibration/ Location ERBE Inversion ERBE Averaging ERBE-Like Products Cloud Imager Data 18 Mo. 30 Mo. Cloud Identification; TOA/Surface Fluxes Angular Distribution Models 24 Mo. Atmospheric Structure Diurnal Models 36 Mo. 36 Mo. Surface and Atmospheric Fluxes CERES Surface Products Geostationary Data 42 Mo. Time/Space Averaging Algorithm Theoretical Basis Documents: http://asd-www.larc.nasa.gov/ATBD/ATBD.html Validation Plans: http://asd-www.larc.nasa.gov/valid/valid.html 42 Mo. CERES Time Averaged Cloud/Radiation TOA, SFC, Atmos
CERES Advances over Previous Missions • Calibration Offsets, active cavity calib., spectral char. • Angle Sampling Hemispheric scans, merge with imager matched surface and cloud properties new class of angular, directional models • Time Sampling CERES calibration + 3-hourly geo samples new 3-hourly and daily mean fluxes • Clear-sky Fluxes Imager cloud mask, 10-20km FOV • Surface/Atm Fluxes Constrain to CERES TOA, ECMWF imager cloud, aerosol, surface properties • Cloud Properties Same 5-channel algorithm on VIRS,MODIS night-time thin cirrus, check cal vs CERES • Tests of Models Take beyond monthly mean TOA fluxes to a range of scales, variables, pdfs • ISCCP/SRB/ERBE overlap to improve tie to 80s/90s data. • CALIPSO/Cloudsat Merge in 2006 with vertical aerosol/cloud Move toward unscrambling climate system energy components
CERES Instrument TRMM: Jan-Aug 98 and Mar-Apr 2000 overlap with Terra Terra: Mar 00 - present planned life: 2006 Aqua: July 02 start Now in checkout Planned life to 2008 NPOESS: TBD: gap or overlap? 2008 to 2011 launch
CERES LW Terra Results - July 2000 CERES Clear-Sky TOA Longwave Flux (W m-2) CERES TOA Longwave Cloud Forcing (W m-2)
CERES SW Terra Results - July 2000 CERES Clear-Sky TOA Shortwave Flux (W m-2) CERES TOA Shortwave Cloud Forcing (W m-2)