Download
1 / 28
• 280 likes • 470 Views
ENSO (El Nino Southern Oscillation). ENVS 110 10-12-2008. http://upload.wikimedia.org/wikipedia/commons/1/18/Wiki_plot_03.png. http://www.pmel.noaa.gov/pubs/outstand/kess2580/images/fig01.gif. http://www.sbg.ac.at/ipk/avstudio/pierofun/atmo/el-scans/el-nino1.jpg.

E N D
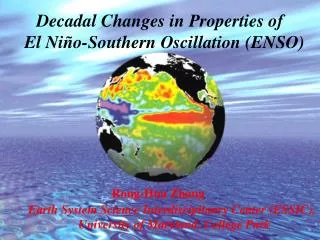
ENSO(El Nino Southern Oscillation) ENVS 110 10-12-2008
http://upload.wikimedia.org/wikipedia/commons/1/18/Wiki_plot_03.pnghttp://upload.wikimedia.org/wikipedia/commons/1/18/Wiki_plot_03.png
http://www.pmel.noaa.gov/pubs/outstand/kess2580/images/fig01.gifhttp://www.pmel.noaa.gov/pubs/outstand/kess2580/images/fig01.gif
http://www.sbg.ac.at/ipk/avstudio/pierofun/atmo/el-scans/el-nino1.jpghttp://www.sbg.ac.at/ipk/avstudio/pierofun/atmo/el-scans/el-nino1.jpg
http://www.sbg.ac.at/ipk/avstudio/pierofun/atmo/el-scans/walker.jpghttp://www.sbg.ac.at/ipk/avstudio/pierofun/atmo/el-scans/walker.jpg
http://www.sbg.ac.at/ipk/avstudio/pierofun/atmo/el-scans/el-nino2.jpghttp://www.sbg.ac.at/ipk/avstudio/pierofun/atmo/el-scans/el-nino2.jpg
http://www.sbg.ac.at/ipk/avstudio/pierofun/atmo/el-scans/catch.jpghttp://www.sbg.ac.at/ipk/avstudio/pierofun/atmo/el-scans/catch.jpg
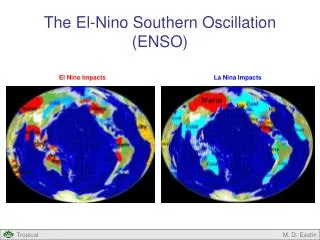
El Nino forecasting • Careful monitoring of • Oceanic temperatures (satellites) • Strength of trade winds sometimes it works – sometimes it doesn’t
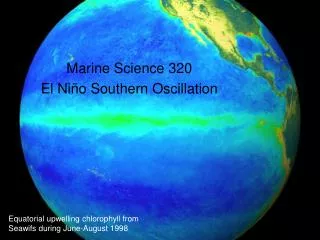
How to measure sea surface temperatures (old school) • automated buoys (get spot measurement, often temperature profile) → buoy arrays • temperature recorders in the water intakes of big ships → variable locations, sampling depth might not be constant (loaded vs. empty vessel) but greater geographical coverage
How to Measure Sea Surface Temperatures from Satellites? • infrared radiation problem: cannot see through clouds, aerosols • electromagnetic radiation at other wavelengths • microwave radiation (can see through clouds and aerosols, but is scattered by raindrops)
how to measure ocean temperature at depth ? • warm water is less dense → takes up more space (floats on top of colder water) • sea surface rises • 50 m of 1C warmer water raises sea surface by approximately 1 cm • after lots of correlations, corrections and other trickery → get temperature distribution with depth
Historical variations Red: El Nino Blue: La Nina
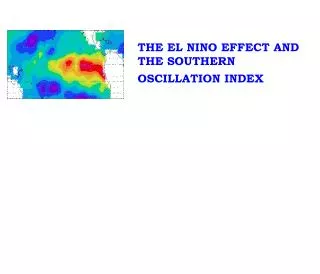
How can you Reconstruct ENSO Cycles ? • Expressed as: • sea surface temperature anomalies • air temperature, atmospheric pressure anomalies in Pacific • precipitation ? • economic effects ? • climate effects outside equatorial Pacific?
source: http://www.worldatlas.com/webimage/countrys/islands/pacifics/tahiti.htm
Darwin Tahiti
The Southern Oscillation Index (SOI) expresses difference in barometric pressure between Australia (Darwin) and Thaiti several ways to calculate Pdiff = MSLPThaiti - MSLPDarwin sustained negative values: El Nino sustained positive values: La Nina
Source: Commonwealth of Australia 2006, Bureau of Meteorology (ABN 92 637 533 532) http://www.bom.gov.au/climate/current/soi2.shtml (accessed 3/13/06)
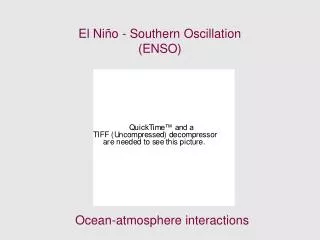
ENSO Cycles • El Nino – La Nina phenomenon is cyclical • Note timescales involved • How rapidly does atmosphere change ? • How rapidly do oceans change ? • Oceans are a good place to look for drivers of short term climate change
http://www.sbg.ac.at/ipk/avstudio/pierofun/atmo/el-scans/rain.jpghttp://www.sbg.ac.at/ipk/avstudio/pierofun/atmo/el-scans/rain.jpg