Download
1 / 9
90 likes | 117 Views
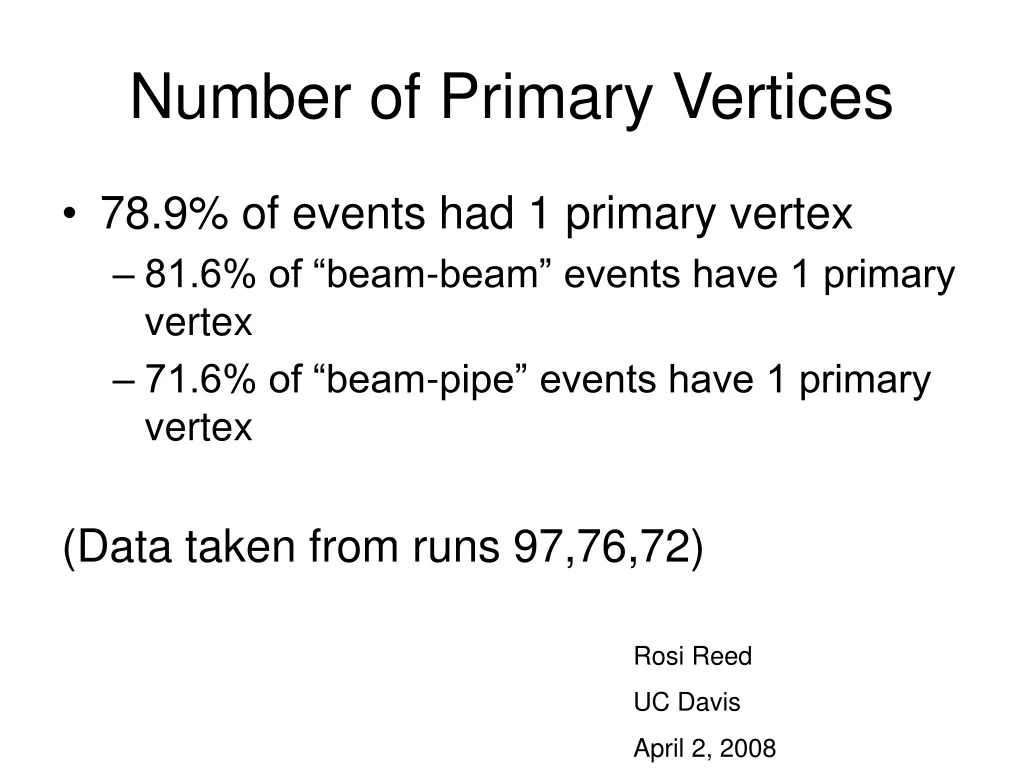
Explore the distribution of primary vertices in particle physics events, including data from runs 97, 76, and 72. Understand the impact of beam-beam and beam-pipe events on primary vertices. Analyze the xy location of secondary and third vertices. Investigate the average Eta per event based on vertex conditions.

E N D
Number of Primary Vertices • 78.9% of events had 1 primary vertex • 81.6% of “beam-beam” events have 1 primary vertex • 71.6% of “beam-pipe” events have 1 primary vertex (Data taken from runs 97,76,72) Rosi Reed UC Davis April 2, 2008
Number of primary vertices Run 97, 76, 72
Number of primary vertices“Beam-Beam” events Run 97, 76, 72
Number of primary vertices“Beam-Pipe” events Run 97, 76, 72
xy Location of Second Vertex for Events with Vertex 1 r > 2 cm Run 97, 76, 72
xy Location of Third Vertex for Events with Vertex 1 r > 2 cm Run 97, 76, 72
Average Eta per Event for Events with Vertex 1 r < 2 cm Run 97, 76, 72 Eta averaged over primary tracks only
Average Eta per Event for Events with Vertex 1 r > 2 cm and |Vz| < 75 cm Run 97, 76, 72 Eta averaged over primary tracks only
Average Eta per Event for Events with Vertex 1 r > 2 cm and |Vz| < 75 cm Run 97, 76, 72 Eta averaged over primary tracks only