Download
1 / 19
• 190 likes • 378 Views
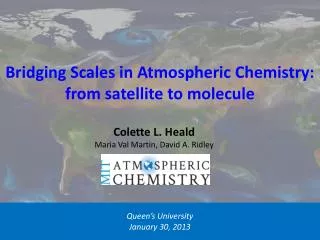
Bridging Scales in Atmospheric Chemistry: from satellite to molecule. Colette L. Heald Maria Val Martin, David A. Ridley. Queen’s University January 30, 2013. Atmospheric Composition is Linked to Major Environmental Issues. AIR QUALITY / HEALTH. ACID RAIN. VISIBILITY. CLIMATE.

E N D
Bridging Scales in Atmospheric Chemistry:from satellite to molecule Colette L. Heald Maria Val Martin, David A. Ridley Queen’s University January 30, 2013
Atmospheric Composition is Linked to Major Environmental Issues AIR QUALITY / HEALTH ACID RAIN VISIBILITY CLIMATE TOXIC ACCUMULATION CROP DAMAGE FERTILIZATION OZONE LAYER
Scientific Challenge: Characterize the Emissions and Transformations Well Enough to Estimate Impacts • Climate Forcing: • GHG warming • Aerosol warming/cooling Evolution of Pollution (Chemistry + Transport) • Air Quality • Impacts: • Visibility • Health • Agriculture • Emissions • Anthropogenic pollution • Natural/biogenic
What’s Really the Problem?Diversity of Scales at Play, Coupled Physical & Chemical Processes deposition emission transport (flux divergence; U is wind vector) local change in concentration with time chemical production and loss (depends on concentrations of other species) 1 box model Global Model Chemical production Chemical loss Inflow Fin Outflow Fout L P X D E Deposition Emission
What Is An Aerosol?(also called particulate matter or PM) Scatter/absorb radiation and critical to cloud formation. The leading cause of uncertainty in climate forcing [IPCC, 2007] By 2030, PM will be the leading environmental cause of premature death (3.6 million deaths/year) [OECD, 2012] Particles in the atmosphere come from both natural and pollution sources, have a range sizes, properties and chemical complexity. They can be emitted directly (e.g. soot from diesel engine) or formed chemically (e.g. sulfate formed down-wind of a power plant)
Challenge: Heterogeneity of Atmospheric Composition GEOS-5 10 km aerosol model Many first order problems with atmospheric species (how much? what sources?) challenging to address because of the short lifetimes and varying properties of gases/particles in the atmosphere. http://www.nasa.gov/multimedia/imagegallery/image_feature_2393.html
Solution: Satellite Observations!Otherwise observation network for tropospheric composition is sparse Tropopause (8-18 km) • solar backscatter • atmospheric emission • occultation • lidar Satellites 22 km STRATOSPHERE sonde TROPOSPHERE aircraft Surface sites ships, islands, buoys
Remote Sensing: The Classic Inverse Problem Given observed spectra, what is the atmospheric state that produced it? ? • Problems: • Non-uniqueness of solution (need to apply a priori information) • Discreteness of measurements of a smoothly varying function • Instability of the solution due to errors in the observations • The whole field of retrieval theory/practice!
Carbon Monoxide: Tracer of Pollution CO Sink: Oxidation by OH OH CH4 NMHC Lifetime = 1-2 months “Simple” chemical evolution LARGE uncertainties on bottom-up emission inventories Biomass Burning Fossil Fuels Biofuels
Carbon Monoxide Transpacific Transport Seen From Space GEOS-Chem x Avgker MOPITT GEOS-Chem Asian pollution exported via cold front Feb 23 Feb 24 Plume encounters a blocking H Pressure System and splits Feb 25 Feb 26 Elevated CO reaches North America Southern branch at low latitudes produces O3 Feb 27 Total column CO Four such events observed in spring 2001. [Heald et al., 2003b]
Integration of Aircraft, Satellite and Models to Quantify Carbon Monoxide Sources from Asia Forward Model (GEOS-Chem CTM) Anthropogenic CO [Streets et al., 2003 and Logan & Yevich] TRACE-P Aircraft CO EMISSIONS OBSERVATIONS Inverse Model (Bayesian linear) Biomass Burning CO [Heald et al., 2003a] MOPITT CO Anthropogenic emissions underestimated (China = 39% too low) Biomass burning emissions too high (SE Asia = 50% too high) [Heald et al., 2004]
Dust From North Africa: Impacting Air Quality and Biospheric Productivity Down-Wind More than half of dust emitted globally from N. Africa TOMS: June 13-21, 2001 summer winter/spring [Prospero et al., 1999] Miami (1989-1997) French Guiana (1978-1979) [Prospero et al., 1981] Observation-poor so rely on models to estimate this. Satellites can provide much needed reality-check!
Using Satellite Observations to Test Simulation of Dust Improve dust particle sizes Winter Summer Seasonally averaged aerosol along Atlantic outflow transects • Improve model simulation near source with better representation of particle size • Model removes too much dust during transport in winter. Reveals that deposition estimates to Amazon are likely a lower limit [Ridley et al., 2012]
Using Satellite Observations to Constrain the Global Budget of Organic Aerosol TgC/yr Summer MISR AOD ??? Simulated AOD from OTHER aerosol Residual = Organic Aerosol Satellite measurements indicate that total OA source is capped at 150 TgC/yr (at lower end of previous estimate) This is still 3 times what is currently included in models. [Heald et al., 2010b]
2012: Most Destructive Fires in Colorado History, with Air Quality Implications High Park Fire (June 2012) Waldo Canyon Fire (July 2012) Preliminary hourly/daily PM2.5 and Satellite AOD over 10 Colorado sites 2012 EPA daily PM2.5 standard Many local exceedances of daily PM2.5 standard (over 100 µg/m3 measured in Fort Collins!) Satellite aerosol observations (AOD) track surface PM observations
Decadal Satellite Record Shows Large Aerosol Anomalies Associated with Both Local and Transported Smoke MODIS Terra AOD anomalies June 2002 August 2012 MT, WY, ID, WA Fires CA Station Fire (2009) AZ, CA Fires AZ Wallow Fire (2011) High Park and Waldo Fires Hayman Fire [val Martin et al., in prep]
Atmospheric Ammonia: A Source of Particulate Matter and Emissions on the Rise… NH3 emissions major source of fixed N + = atmospheric acids (H2SO4, HNO3) Agriculture Animals Haber-Bosch Process (industrial production of NH3 fertilizer) has dramatically increased global food production. …degrading air quality? now and in the future? Atmospheric NH3 is difficult to measure [Erisman et al., 2008]
Insight Into Ammonia Sources over the US New satellite measurements offer unprecedented monitoring of NH3. Comparison with model reveals springtime underestimate of emissions in the Midwest and year-round underestimate in the Central Valley of California (AQ exceedances). [Heald et al., 2012]
Atmospheric chemistry central to several environmental issues (air quality, climate, ecosystem health, etc) Atmospheric composition is highly heterogeneous. Satellite observations providing unprecedented constraints on emissions, transport and budgets of gases and aerosols in the atmosphere. (EngPhys was surprisingly good preparation for all this!) Funding Acknowledgements: