Download
1 / 26
260 likes | 415 Views
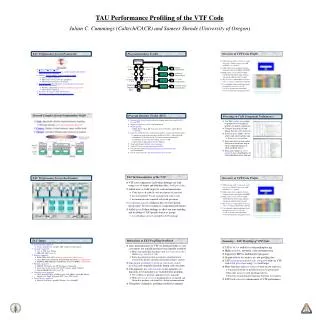
Profiling S3D on Cray XT3 using TAU. Sameer Shende tau-team@cs.uoregon.edu. Acknowledgements. Alan Morris [UO] Kevin Huck [UO] Allen D. Malony [UO] Kenneth Roche [ORNL] Bronis R. de Supinski [LLNL]. TAU Parallel Performance System. http://www.cs.uoregon.edu/research/tau/

E N D
Profiling S3D on Cray XT3 using TAU Sameer Shende tau-team@cs.uoregon.edu
Acknowledgements • Alan Morris [UO] • Kevin Huck [UO] • Allen D. Malony [UO] • Kenneth Roche [ORNL] • Bronis R. de Supinski [LLNL]
TAU Parallel Performance System • http://www.cs.uoregon.edu/research/tau/ • Multi-level performance instrumentation • Multi-language automatic source instrumentation • Flexible and configurable performance measurement • Widely-ported parallel performance profiling system • Computer system architectures and operating systems • Different programming languages and compilers • Support for multiple parallel programming paradigms • Multi-threading, message passing, mixed-mode, hybrid
TAU Performance System Architecture event selection
Program Database Toolkit (PDT) Application / Library C / C++ parser Fortran parser F77/90/95 Program documentation PDBhtml Application component glue IL IL SILOON C / C++ IL analyzer Fortran IL analyzer C++ / F90/95 interoperability CHASM Program Database Files Automatic source instrumentation TAU_instr DUCTAPE
PAPI • Performance Application Programming Interface • The purpose of the PAPI project is to design, standardize and implement a portable and efficient API to access the hardware performance monitor counters found on most modern microprocessors. • Parallel Tools Consortium project • Developed by University of Tennessee, Knoxville • http://icl.cs.utk.edu/papi/
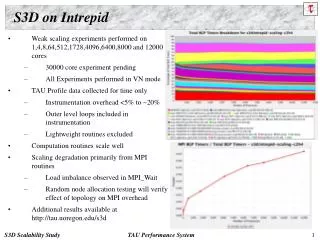
S3D - Building with TAU • Change name of compiler in build/make.XT3 • ftn=> tau_f90.sh • cc => tau_cc.sh • Set compile time environment variables • setenv TAU_MAKEFILE /spin/proj/perc/TOOLS/tau_latest/xt3/lib/ Makefile.tau-callpath-multiplecounters-mpi-papi-pdt-pgi • Choose callpath, PAPI counters, MPI profiling, PDT for source instrumentation • setenv TAU_OPTIONS ‘-optTauSelectFile=select.tau -optPreProcess’ • Selective instrumentation file eliminates instrumentation in lightweight routines • Pre-process Fortran source code using cpp before compiling • Set runtime environment variables for instrumentation control and event PAPI counter selection in job submission script: • export TAU_THROTTLE=1 • export COUNTER1 GET_TIME_OF_DAY • export COUNTER2 PAPI_FP_INS • export COUNTER3 PAPI_L1_DCM • export COUNTER4 PAPI_RES_STL • export COUNTER5 PAPI_L2_DCM
Selective Instrumentation in TAU % cat select.tau BEGIN_EXCLUDE_LIST MCADIF GETRATES TRANSPORT_M::MCAVIS_NEW MCEDIF MCACON CKYTCP THERMCHEM_M::MIXCP THERMCHEM_M::MIXENTH THERMCHEM_M::GIBBSENRG_ALL_DIMT CKRHOY MCEVAL4 THERMCHEM_M::HIS THERMCHEM_M::CPS THERMCHEM_M::ENTROPY END_EXCLUDE_LIST BEGIN_INSTRUMENT_SECTION loops routine="#" END_INSTRUMENT_SECTION
TAU’s ParaProf Profile Browser - Manager Derived Metrics Flops = PAPI_FP_INS/wallclock time
Main Window - 8 cpus (MPI Ranks 0-7) Some routines execute on different sets of processors
Callpath Thread Relations Window parent routine children
TAU’s ParaProf Profile Browser - Manager Different sections of code within the same routine execute on odd and even processors!
Getting Access to TAU on Jaguar • set path=(/spin/proj/perc/TOOLS/tau_latest/x86_64/bin $path) • Choose Stub Makefiles (TAU_MAKEFILE env. var.) from /spin/proj/perc/TOOLS/tau_latest/xt3/lib/Makefile.* • Makefile.tau-mpi-pdt-pgi (flat profile) • Makefile.tau-mpi-pdt-pgi-trace (event trace, for use with Vampir) • Makefile.tau-callpath-mpi-pdt-pgi (single metric, callpath profile) • Binaries of S3D can be found in: • ~sameer/scratch/S3D-BINARIES • withtau • papi, multiplecounters, mpi, pdt, pgi options • without_tau