Download
1 / 25
250 likes | 386 Views
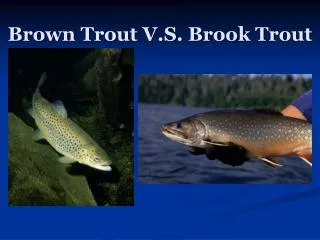
Ranking Brook Trout Habitat Patches for Resiliency to Climate Change. Brad Trumbo And Mark Hudy USDA Forest Service Fish and Aquatic Ecology Unit James Madison University, Biology Department Virginia Department of Game and Inland Fisheries.

E N D
Ranking Brook Trout Habitat Patches for Resiliency to Climate Change Brad Trumbo And Mark Hudy USDA Forest Service Fish and Aquatic Ecology Unit James Madison University, Biology Department Virginia Department of Game and Inland Fisheries
Under various climate change scenarios, brook trout are predicted to be extirpated from many states. • Flebbe et al. 2006. Spatial Modeling to Project Southern Appalachian Trout Distribution in a Warmer Climate. TAFS • Clark et al. 2001. Predicting Climate Change Effects on Appalachian Trout: Combining GIS and Individual –Based Modeling. Ecological Applications. • Meisner. 1990. Effect of Climatic Warming on the southern margins of the Native Brook Trout . CJAS USDA Forest Service Fish and Aquatic Ecology Unit
Are the model’s accurate at smaller scales? Are small refugia likely ? • Small Area Influences • Land use • Riparian vegetation • Groundwater • Aspect • Elevation • Latitude • Solar input
While large scale climate models predict extirpation throughout much of the EBTJV study area, our pilot studies suggest potential refugia for brook trout. 2. Refugia may exist because of the different air/water temperature relationships at the catchment scale. A question of Scale ? USDA Forest Service Fish and Aquatic Ecology Unit
Landscape characteristics can explain the residuals of these local air/water temperature relationships. Models predicting these air/water temperature relationships from local landscape characteristics can be used to rank brook trout populations for resiliency to climate change. These rankings can be used by managers for prioritization of future, protection and restoration efforts of the EBTJV. Working hypothesis: USDA Forest Service Fish and Aquatic Ecology Unit
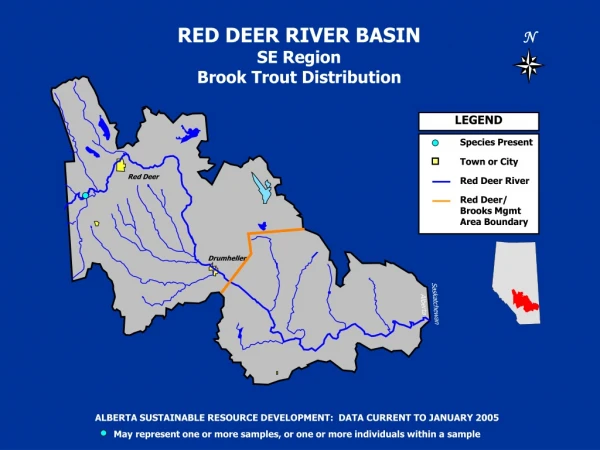
EBTJV Data Set USDA Forest Service Fish and Aquatic Ecology Unit
Sampling Methods • Paired air and water temperature data will be used to develop the unique sigmoid curve function for the pour point and centroid of each selected patch. centroid Pour point USDA Forest Service Fish and Aquatic Ecology Unit
Sample Duration • Temperature data is being collected at 30 minute intervals for 17 months including two critical summer periods (July-September 15) • Various temperature metrics will be plotted to detect critical limits as well as define the air/water temperature relationships. USDA Forest Service Fish and Aquatic Ecology Unit
Thermograph Specifications Onset HOBO Water Temp Pro v2 • Operation Range: -20 to 70°C • Accuracy: 0.2°C over 0° to 50°C • Resolution: 0.02°C at 25°C USDA Forest Service Fish and Aquatic Ecology Unit
Percent Riparian Canopy Cover Total Annual Riparian Area Solar Gain (kWh) Total forest area in each patch Pour Point Elevation 30 year annual mean max air temperature at the Pour Point Number of springs in each patch Candidate Metrics for Clustering USDA Forest Service Fish and Aquatic Ecology Unit
Table Comparing Cluster Metrics USDA Forest Service Fish and Aquatic Ecology Unit
Summary • Managers need climate change information at various scales. This project focuses on monitoring at the habitat patch scale. • Habitat patches have different air/water temperature relationships that can be explained by landscape charactersitics. • Identify brook trout patches within the EBTJV. • Stratified random subsample ( n = 200) of patches from cluster groupings. • Collecting matched air/water temperature data at pour point and centroid of selected patches. • Model landscape charactersitics that explain Air/water temperature relationships.