Download
1 / 13
130 likes | 291 Views
Warm Up- CW Grade. Use the information in the table (from yesterday) to: Make a Relative Frequency Table Make a Relative Frequency Bar Graph Make a Pie Chart. HW Questions. Textbook p. 16-18 # 2, 12, 22, 25, 26. Answer Key. Answer Key. Contingency Tables. CH. 3 Day 2 AP Statistics

E N D
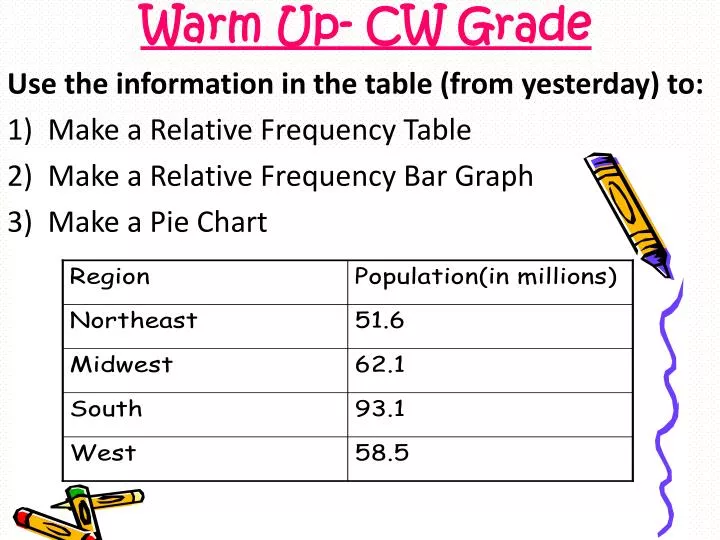
Warm Up- CW Grade Use the information in the table (from yesterday) to: • Make a Relative Frequency Table • Make a Relative Frequency Bar Graph • Make a Pie Chart
HW Questions Textbook p. 16-18 # 2, 12, 22, 25, 26
Contingency Tables CH. 3 Day 2 AP Statistics EQ: How do we find percentages from contingency tables?
Contingency Tables • Tables that show how the individuals are distributed along each variable • The frequency distribution for a two-way statistical classification. • Ex.
What percent of the Titanic passengers were in First Class? • What percent of Titanic passengers died? • What percent of Third Class passengers survived? • What percent of people who died were from Fourth class? • Find the marginal distribution of class.
What proportion of people ages 25-49 are black? 2. What proportion of white people are 24 or younger? 3. Compute the following percentages: • Hispanic people • Hispanic people given they are 50 or older • Hispanic people given they are 25-49 • Hispanic people given they are <24
Summarizing/CW Rules: Number your paper #1-10. Pick a spot to begin at, Ignore the answer at the top of that page, Instead look at the question in small print.Answer the Question and write it in as #1. Look for the Answer at the top of another page posted somewhere around the room. Go to that page. Your next question is the small print on that page. Repeat process until you get back to the page you started at. You must go in order to receive credit- Turn in When finished.
Homework P. 36-44 # 18, 19, 21, 26, 32