Download
1 / 16
160 likes | 264 Views
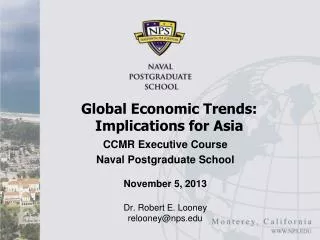
GROWTH SET TO CONTINUE: Marco-Economic Outlook for Asia/Pacific. GDP growth (%). Size of Middle Class (in million). Highest growth region with changing trade patterns and increasing portion of domestic demand.

E N D
GROWTH SET TO CONTINUE: Marco-Economic Outlook for Asia/Pacific GDP growth (%) Size of Middle Class (in million) Highest growth region with changing trade patterns and increasing portion of domestic demand Every 1% gained in private consumption translates into over $70b more in consumption 1) Source: Economist Intelligence Unit Update; 2) Master Card estimates
REGION ASIA – THE NATURE OF THE BEAST Singapore Japan Thailand Ethnic groups: Languages: Religions: % sales of modern trade Ave. price per footwear (€) • Chinese, Malay, Indian, Others • English, Malay, Mandarin, etc. • Christian, Buddhist, Muslim, etc • >80% • 48.2 Ethnic groups: Languages: Religions: % sales of modern trade Ave. price per footwear (€) • 99 %Japanese • 1 % Others • Japanese • ShintoBuddhist,Others • >90% • >48 China Ethnic groups: Languages: Religions: % sales of modern trade Ave. price per footwear (€) • 75% Thai • 8% Chinese • 17% Others • Thai • Buddhist, others • ~30% • 14.1 India Ethnic groups: Languages: Religions: % sales of modern trade Ave. price per footwear (€) • 93%Chinese • 7% others • Mandarin • >100dialects • Confuc-ianism Buddhism,Taoism,others • <10% • 3.4 Ethnic groups: Languages: Religions: % sales of modern trade Ave. price per footwear (€) • 336 major tribes • Hindi • 1,600 dialects • Hindu • Muslim • Others • <5% • 2.3 People TradeStruc. Pricing High Mid Economic development Low Very Low Source: Lit search; CIA Factbook; BCG analysis
REGION ASIA – THE NATURE OF THE BEAST • Half of the world population • Young population … • … >50% below 30 years old • Increasing concentration in cities • … 30% 0 to 14 years old Population
ASIA PACIFIC RELATIVE SIZE OF ECONOMIES 10000 China India 1000 Indonesia Japan Philippines Vietnam 100 Korea Thailand Population (million) Malaysia Taiwan 10 Hong Kong Singapore 100 100000 1000 10000 GNI Per Capita (US$) 2002
ASIA PACIFIC RELATIVE SIZE OF ECONOMIES MEASURED WITH PURCHASING POWER PARITY 10000 China India 1000 Indonesia Thailand Japan 100 Korea Philippines Population (million) Vietnam Taiwan Malaysia 10 Hong Kong Singapore 1000 10000 100000 GNI Per Capita (US$) 2002 PPP
UNDERSTANDING ASIA By 2010…… • 30 towns of >5 million habitants 2 in USA, 6 in Europe) • Shanghai, Bombay > 20 million • Beijing, Indonesia, Manila, Calcutta, Delhi, Tianjin, Dacca >15 million
UNDERSTANDING ASIA NOMINAL PRIVATE CONSUMPTION FOR ASIA-PACIFIC AT A GLANCE 6 Megatrends in the Region Nominal private consumption (US$ Bn) • from village to Metropolitan • from export to market demand • from poverty to major savings • from labor force to advanced technologies • from isolation to integration • the asianisation of the world 2003 2008 Asia-Pacific Aggregate
China Asia Europe 30% USA 20% 10% 6% UNDERSTANDING ASIA 6 Megatrends in the Region • from village to Metropolitan • from export to market demand • from poverty to major savings • from labor force to advanced technologies • from isolation to integration • the asianisation of the world
UNDERSTANDING ASIA 6 Megatrends in the Region • from village to Metropolitan • from export to market demand • from poverty to major savings • from labor force to advanced technologies • from isolation to integration • the asianisation of the world
UNDERSTANDING ASIA 6 Megatrends in the Region • from village to Metropolitan • from export to market demand • from poverty to major savings • from labor force to advanced technologies • from isolation to integration • the asianisation of the world
UNDERSTANDING ASIA 6 Megatrends in the Region • from village to Metropolitan • from export to market demand • from poverty to major savings • from labor force to advanced technologies • from isolation to integration • the asianization of the world
CHALLENGES FOR ASIA PACIFIC • Poverty • Unemployment • Financial Fragility • Infrastructure • Corruption • Deregulation & Trade Liberalization
THE TOP 20 BRANDS ACROSS EIGHT ASIAN MARKETS Source: “media Portfolio” 16 July 2004