Download

1 / 11
110 likes | 223 Views
Weather Part IV Storms. Reference: CK-12.org Earth Sciences Chapter 16 By: Robert Smith. Weather Forcasting. According to the World Meteorological Organization (WMO), a 5-day weather forecast today is as reliable as a 2-day forecast was 20 years ago . Thermometers.

E N D
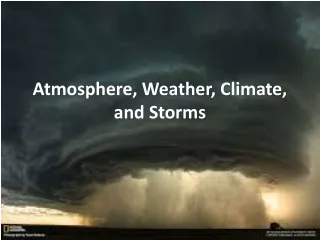
Weather Part IVStorms Reference: CK-12.org Earth Sciences Chapter 16 By: Robert Smith
Weather Forcasting • According to the World Meteorological Organization (WMO), a 5-day weather forecast today is as reliable as a 2-day forecast was 20 years ago
Thermometers • Thermometers measure temperature • modern thermometers use a coiled strip composed of two kinds of metal, each of which conducts heat differently. • Modern thermometers usually produce digital data
Barometers • barometers to measure air pressure • Modern meters are all digital • change in barometric pressure indicates that a change in weather is coming • pressure falls, a low pressure cell is coming • air pressure rises, a high pressure cell is on the way • Barometric pressure data over a larger area can be used to identify pressure systems, fronts, and other weather systems
Weather Station • Weather stations contain some type of thermometer and barometer • Other instruments measure different characteristics of the atmosphere such as wind speed, wind direction, humidity, and amount of precipitation • weather information is collected from 15 satellites, 100 stationary buoys, 600 drifting buoys, 3,000 aircraft, 7,300 ships, and some 10,000 land-based stations
Radiosondes • Radiosondes measure atmospheric characteristics, such as temperature, pressure, and humidity as they move through the air • dropped from a balloon or airplane to make measurements as they fall.
Radar • stands for Radio Detection and Ranging • transmitter sends out radio waves that bounce off the nearest object and then return to a receiver • Doppler radar can also track how fast the precipitation falls • Outline the structure of a storm
Satellites • observe all energy from all wavelengths in the electromagnetic spectrum. • Visible light images record storms, clouds, fires, and smog • Infrared images record clouds, water and land temperatures
Automation • most accurate weather forecasts are made by advanced computers • have up-to-date mathematical models that can use much more data and make many more calculations than would ever be possible by scientists
Weather Maps • depict meteorological conditions in the atmosphere • depict information from computer models or from human observations • many different symbols as a quick and easy way to display information on the map
Map terms • Lines of equal temperature are called isotherms • Can indicate fronts • Isobars are lines of equal average air pressure at sea level • Indicate high and low pressure cells • Isotachs are lines of constant wind speed • Low values high in the atmosphere indicate cyclone warning • High wind speeds high in the atmosphere indicate the jet stream’s location