Download
1 / 19
190 likes | 306 Views
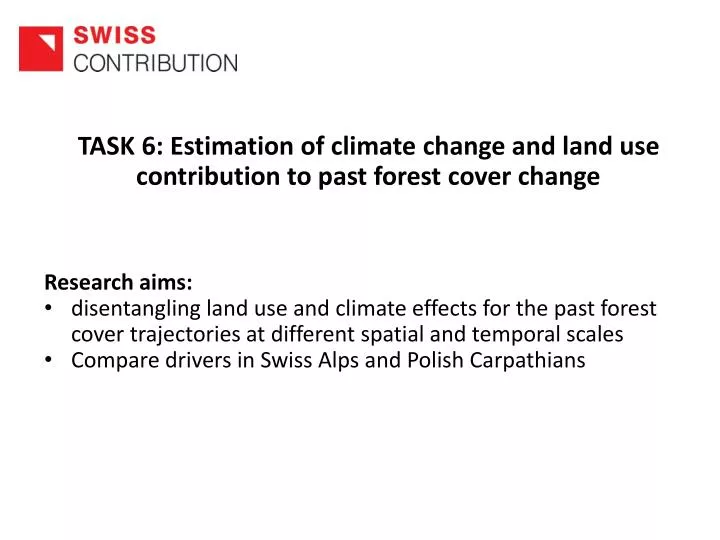
TASK 6: Estimation of climate change and land use contribution to past forest cover change Research aims: disentangling land use and climate effects for the past forest cover trajectories at different spatial and temporal scales Compare drivers in Swiss Alps and Polish Carpathians.

E N D
TASK 6: Estimation of climate change and land use contribution to past forest cover change Research aims: • disentangling land use and climate effects for the past forest cover trajectories at different spatial and temporal scales • Compare drivers in Swiss Alps and Polish Carpathians
Potential drivers Scaleofanalysis climate/ topography context 100m raster/30 m raster Target variable: Loss/gain (binary) • Administrative units • Communes • Districts Target variable: change in forest proportion (abs/rel) socioeconomics Test different combinationsofdrivers at different spatialresolutions
Socio-economicdata – list of variables PL/CH • Not fullsetofvariables availablefor all periodsandstudyregions Selectionbased on hypothesis/availability
Socio-economicdatabase • basic data: • shapefiles with cities and villagies boundaries (1850, 1931, 1970, 2011) • shapefiles with communesboundaries (1970, 2011) • socio-economic data: • tables with socio-economic data on level of cities and viligies (1850, 1931) • tables with socio-economic data on level of communes (1970, 2011)
Socio-economicdatabase • Input data for models: shapefile with socio-economicinformation on „communes” level (1850, 1931, 1970s, 2011)
Context Data • Contextual variables include information that are determined by their locatione.g.: • distance to existingforest (biological system) • distance to road/settlement (socio-economy)
Climate Data Basic dataset(1931/1961-2010) Monthlytemperatureandprecipitationdownscaledto 100m resolution • Historical data (1850-1930/1960) • CH: Calculateanomaliesto multi-proxy historical time series; monthlytemperature (Luterbacher), seasonalprecipitation (seasonal,Pauling). • PL: anomalieshistorical time seriesKrakow • Spatial Interpolation (100m/90 m grid) Final data(1850-2010) Meanvaluesfortemperatureandprecipitation (periods same asforfcc) MeanannualDDsum
Correlation coefficient values: TT Krakowvs TT Carpathian Stations in January (1961-2010)
Analysis concept – CH/PL • analysisattwoscales: • Admin units (communities, districts) • 1 ha rastercells (CH) [~106 pixels], 30 m(PL) [~22*106 pixels] • General assumption: • climaticandtopographic variables play a role at smallerscales(pixels) whilesocio-economicsis relevant at larger scale (communes/districts) • Statistical approach: generalized linear regressionmodels (GLM)
Drivers context climate/topo 1 ha raster (n=969’700) Target variable: forestloss/forestgain Administrative units Target variable: change in forestcoverproportion socioeconomics Test different combinationsat different scales
Drivers offorestgain Model: GLM (binomial) stepwise, sample: 10’000 non- forestpixels at t1 Target variable: forestgain (yes/no) Explanatory variables: exposition (northeness/eastness), altitude, slope, distancetoforestedgeat 1st time step, distancetosettlement Adj D2
Drivers offorestloss Model: GLM (binomial) stepwise, sample 10’000 forestpixels at t1 Target variable: forestgain (yes/no) Explanatory variables: exposition (northeness/eastness), altitude, slope, distancetoforestedgeat 1st time step, distancetosettlement Adj D2
Explainingforestcoverbytopographyandpreviousforestcover? Model: GLM (binomial) stepwise, sample 10’000 of all pixels Target variable: forest (yes/no) Explanatory variables: exposition (northeness/eastness), altitude, slope, forestcover at previous time step Adj D2
Problem ofspatialautocorrelation Examplemodellinggain 1850-1880 Sample size 10’000 -> 819 Model performance (Adj D2) 0.35 -> 0.3 Implementing 2 km distancethreshold
Drivers context climate/topo 1 ha raster (n=969’700) Target variable: forestloss/forestgain Administrative units Target variable: change in forestcoverproportion socioeconomics Test different combinationsat different scales
Appropriateadminunit? Forestcover vs. Population change ( relative changes 1940-2010) Communities (n=199) Districts (n=15) Forestcoverchange populationchange correlationwithproportionofolderpeople (60+) at districtlevel
Conclusionsand open questions • Approach allowsforcomparingspatialscales,periods. -> changingexplanatory power of variables/ setsof variables over time andspace • Sampling: all points, random, stratified, autocorrelation • Absolute vs. relative change (forestcover/socioecon variables) • Takingintoaccount lag effects?