Download
1 / 31
380 likes | 485 Views
Flybe SMS and Flight Data Analysis. 21/05/2009. Captain Neil Woollacott. The Flybe Fleets. E 195. Q400. Flybe Today. Flybe is Europe’s largest and most successful regional airline. Serving 13 countries; Over 190 routes flown; Operating from 36 UK and 30 European airports;

E N D
Flybe SMS and Flight Data Analysis 21/05/2009 Captain Neil Woollacott
The Flybe Fleets E 195 Q400
Flybe Today Flybe is Europe’s largest and most successful regional airline • Serving 13 countries; • Over 190 routes flown; • Operating from 36 UK and 30 European airports; • Largest airline at 9 UK airports by flights; • 7.5m passengers 2008. • Revenues of £536m in 2007/08, record profits of £35.4 million. • Fourth most spontaneously recalled aviation brand in the UK; • Operating 73 Aircraft; • Over 500 flights a day.
How Flybe’s Safety Reporting System work’s The Company encourages all personnel to report any event which is considered to be in the interests of Flight Safety THE COMPANY FOLLOWS A A JUST CULTURE SafetyNet is a tool that enables pilots to submit safety reports which come through to the flight safety department where we can quickly access the details and begin investigations.
Safety Report Process Safety & Quality will submit GORs on SafetyNet Crew will submit ASRs on SafetyNet Safety & Quality will submit EORs on SafetyNet The Safety Coordinator will • Cross reference will the CAP382 • Determine the descriptor & Risk MORs CAA GORs EORs The investigation is allocated an owner ASRs Ground Safety Engineering Fleet Managers Flight Safety MORs Closures Flight Safety Cabin Safety Ground Safety Engineering Aviation Services Investigation findings are submitted to the Safety/ Quality Department who reviews and completes a compliance check Require additional information No additional information required Closure Report is submitted onto the Public Summary 25/11/08
Air Safety Reporting Process Crew Complete an ASR Central Safety will determine which department the ASR will go to and then cross reference it with the CAP 382 to establish whether it is reportable under the MOR scheme MOR reports are emailed to the CAA Incidents are sent through SafetyNet as an e-mail in a PDF format to the relevant external investigator e.g. ATC. Providing that we have all the details a full investigation is carried out. Notes and action responses are entered into SafetyNet When flight safety is satisfied that an investigation is complete, it is closed
SafetyNet • Full electronic reporting system • Fully transportable • Easy to use • Full audit trail • Full trend facilities • Use at remote locations • Direct link with Flight Data System • Many default form types e.g Airprox,Birdstrike. • Approved Use by the CAA.
Safety Plan 2009/10
Central Safety Management System Operational Safety Meeting (monthly) Chair : Director Safety, Quality & Training Vice Chair : Head of Safety & Quality Director Aircraft Operations Director Aviation Services Post Holders Safety Coordinators HS&E Director SMS Admin Chief Officer (as required) Postholder Safety Meetings (monthly) Flight Ops Maintenance Ground Ops Health and Safety Postholders, Safety Coordinators Department Managers (as required) Production Meeting Operating Board (monthly) Chief Operating Officer Flybe Group Board Flybe Safety Committee (Quarterly Oversight) Non-Exec Director Objectives and Goals of the Safety Management System Ensure that everyone understands safety responsibilities. • Develop and maintain a culture of safety • Equip people to carry out their tasks safely • Identify and minimise risks to safety and health • Develop safe systems of work • The Company promotes safety with others • Plans to mitigate the consequences of Accidents & other emergencies • Monitor safety performance
The Flybe Top 5 Safety Concerns On analysing the safety statistics the Operational Safety Meeting have complied five key areas that pose the highest safety risk to the company. Flybe intends to focus on these key areas during 2009/10 within the Safety Plan Human Factors/Discipline Ground De-Icing Effectiveness Q400 Landing Gear FLYBE SAFETY PLAN Altitude Deviations Loading Errors Medium & High Risk The probability that the company will have a high risk event is remote in 2009/10
Risk Analysis & Product Safety Monitoring DATA COLLECTION HAZARD IDENTIFICATION EVALUATION OF SCENARIOS AND CONSEQUENCES RISK ANALYSIS & ASSESSMENT QUANTIFY RISK The core of the Product Safety Monitoring Process is the RISK ANALYSIS & ASSESSMENT. DECISION MAKING IMPLEMENTATION AND MONITORING
P r i o r i t y Establishing Safety Priorities Potential for Primary cause for an accident The traditional approach divided the issues into Safety Concern and No Safety Concern categories. This approach is very subjective and does not establish priorities for safety related issues. Potential contributing factor of an Accident Eventual Reduction on Safety Margin Safety Concern Causing Operational disturbance No Safety Concern No Safety Relevance
Reflects the uncertainty regarding assumptions made and the knowledge and control of the related technology. Establishing Safety Priorities – Risk Index Probability Level Level of control RI Severity Classification x + = Severity Classification 1 – Minor (Slight reduction of safety margins) (Routine changes of flight plan) 2 – Major (Significant reduction of safety margins) (Reduction of crew ability to cope with situation) (Phisical effects / injuries to occupants) 3 – Hazardous (Large reduction of safety margins) (Crew cannot be relied upon to implement defenses) (Injuries / death of small proportion of occupants) 4 – Catastrophic (possible loss of airplane with multiple fatalities) Probability Level 5–Frequent( P 10-3 ) 4 – Probable ( 10-3 to 10-5 ) May occur one or more times during the operational life of each airplane of the fleet 3– Remote ( 10-5to 10-7 ) Unlikely to occur to each airplane, but may occur several times during the operational life of the fleet 2– Extremely remote ( 10-7to 10-9 ) Not expected to occur to each airplane, but may occur a few times during the operational life of the fleet 1– Extremely improbable (P 10-9 ) Not expected to occur PRELIMINARY RISK INDEX CALCULATION
14 13 12 11 10 9 8 7 6 5 4 3 2 I n d e x Establishing Safety Priorities Using the Risk Analysis Tool, each issue receives an index number, indicating the related priority. Potential for Primary cause for an accident Immediate Action Required A Potential contributing factor of an Accident B Action for Risk Reduction Eventual Reduction on Safety Margin P r i o r i t y C Improve System Reliability Causing Operational disturbance D Monitor E No Safety Relevance
Time-Reference Table for Action Planning Using the RI, the safety priority of each issue can be directly perceived by all involved areas of the company using a Time-Reference chart:
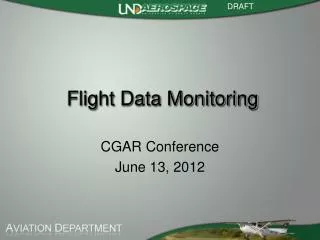
FDM Flight Data Monitoring
What Is FDM ? Definition “A systematic method of accessing, analysing and acting upon information obtained from digital flight data records of routine operations to improve safety” FDM involves the pro-active use of flight data to identify and address operational risks before they can lead to incidents and accidents
The Heinrich Pyramid Why use FDM ? For every major accident there are several less significant accidents, hundreds of reportable incidents and thousands of unreported Occurrences FDM gives more detail on the incidents, encourages more consistent reporting and fills in the void that we know very little about FDM Incidents
Important Ingredients Important ingredients A non-punitive company policy/open safety culture The Flight Safety Manager must be • Trusted by crews to be impartial and maintain confidentiality • Supported and trusted by management The system and its technology will be worthless (or destructive) if the human factors are wrong
Typical Management Process Flight Data Flight Safety Manager Data Replay, Analysis and Verification Cross check BASIS Changes to Procedures, Manuals, Training and Flight Safety Investigations Telephone Crew Review Meetings: FSM, Fleet Training Mgr (all data de-identified) Besafe Mag
Program development The Ground-Based System REMOTE BASES MAIN BASES WAN data transfer Maintenance & Development WLAN Back-up System Download To PC Replay & Analysis System
Flight Safety Analysis System
Flight Data Analysis Event analysis Detects exceedences of pre-defined operational envelopes and provides information on the extremes of the operation. Measurement analysis Takes a set of measurements on every flight and provides information on the whole operation – quantifies normality
Benefits Environmental operating limitations CRM Culture at remote operating bases Pilot knowledge & skill Gaps in the training system Operating procedures
Feed Back - Training FDM lessons can be fed back into the training process Information can identify areas for improvements in training Events can be used to highlight key safety-related points Data can be used to improve pilot techniques Another deep landing
Feed Back - Engineering Enables continuous checking of FDR parameters Data can be used to troubleshoot pilot reported problems (e.g. event created to trap intermittent engine fault) Data can be used to assess structural impact of events (e.g. hard landing) Data can be used to detect misuse which could impact reliability
Summary FDM provides valuable information on the risks associated with new areas of operation Events can identify hazards which otherwise may not come to light The Company can take appropriate corrective and preventative measures
Summary The measurements will build a useful picture of everyday operations which has not previously been available The FDM programme gives us a pro-active use of flight data which significantly enhances the safety of our operation.