Download
1 / 34
350 likes | 483 Views
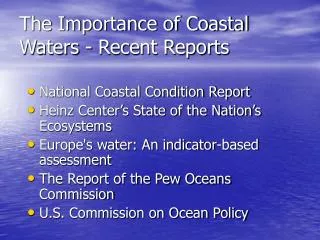
Validation of PBL Schemes over Southern New England Coastal Waters Using the IMPOWR Field Campaign. Matthew J. Sienkiewicz and Brian A. Colle NROW 2013 11-December-2013. Outline. Motivation (Offshore Wind Energy) PBL Schemes How do schemes perform in coastal waters?

E N D
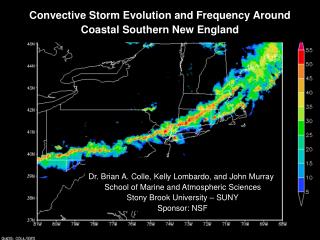
Validation of PBL Schemes over Southern New England Coastal Waters Using the IMPOWR Field Campaign Matthew J. Sienkiewicz and Brian A. Colle NROW 2013 11-December-2013
Outline • Motivation (Offshore Wind Energy) • PBL Schemes • How do schemes perform in coastal waters? • Historical Study Period • Buoy/Tower verification • IMPOWR Field Campaign • Long-EZ Aircraft Flights • Summary
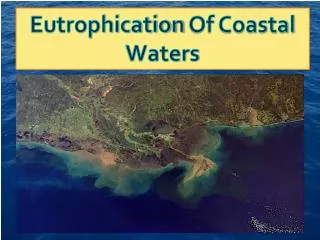
United States Offshore Wind Resource National Renewable Energy Laboratory, U.S. Department of Energy Bathymetry Wind Speed at 90 m Shallow coastal waters and high wind resource at hub height make Southern New England a prime location for offshore wind farms.
Forecasting for Offshore Wind Farms • Day-ahead / Hour-ahead power output forecasts • NWP mesoscale models • Uncertainty forecasts (ensembles) • Neural Network corrections to obtain power output • CFD models http://www.wind-power-program.com/turbine_characteristics.htm
Turbulence Closure Schemes Simplified Mean Equations Need to solve for unknown covariance terms First-order Closure TKE-order Closure Second-order Closure Covariance terms are solved for using their respective rate equations and approximations for the third moments where is the eddy diffusivity of . where is an empirical length scale, and is the TKE. (Garratt 1992)
Planetary Boundary Layer Schemes • Most schemes developed and tested over land • WRF PBL comparison studies mostly done over land • Kansas – schemes overestimated heights of LLJs and underestimated wind speeds (Storm 2008) • Kansas – large nocturnal wind speed biases, inaccurately simulated stable boundary layer (Shin and Hong 2011) • Few WRF PBL comparison studies done over ocean • Japan – positive wind speed bias in lower PBL (Shimada et al. 2011) • North Sea – updating master length scale in MYJ scheme better represented wind shear in lower PBL (Suselj and Sood 2010)
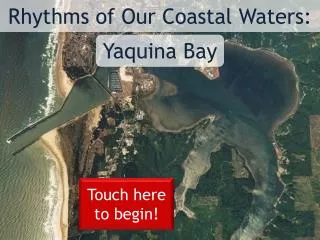
How do the WRF PBL schemes perform in the Southern New England coastal marine environment? Study divided into two distinct periods Historical Period2003-2011 IMPOWR Field Campaign2013 Set of 4km WRF runs verified using data from the Cape Wind Meteorological Mast, as well as available NDBC platforms. Joint campaign with University of Delaware to observe MBL with high-frequency tower and aircraft measurements during Spring/Summer 2013.
Historical Study Period Cape Wind Meteorological Mast • WRF-ARW (v3.4.1) • CW tower data (2003-2011) • Multi-level winds and temperatures • 90 randomly and uniformly selected dates • Cool season/warm season • 00z/12z initialization times • Six PBL schemes • First-Order • YSU, ACM2 • TKE-Order • MYJ, MYNN2, BouLac, QNSE • 30-hour simulations • Focus is on operational hour-ahead wind forecasts • NARR as boundary/initial conditions 41 m 60 m 20 m WRF DOMAINS http://www.capewind.org
Available Marine Observing Platforms 2003-2011 Only focusing on near-shore stations with solid data records http://www.ndbc.noaa.gov/maps/northeast_hist.shtml • WRF results were bi-linearly interpolated to each station for verification. • Observed winds were corrected from the buoy anemometer height of 5 meters to a standard height of 10 meters using where .
WSP BIASES – Northern Buoys (44013 and 44018) • Weakly Positive Biases during Night • Weaker to Negative during Day • Stronger Positive Warm Season Biases • Strongest at Night
WSP BIASES – Southern Buoys (44017 and 44025) • Smaller to more negative biases for both day and night compared to Northern Buoys • Weaker Warm season biases than Northern Buoys • Biases now stronger during Day
WSP BIASES – CMAN Stations (ALSN6 and BUZM3) • BouLac scheme shows consistent negative bias • Negative Bias during Night
TEMP BIASES – Northern Buoys (44013 and 44018) • Weak warm biases • Stronger warm biases
TEMP BIASES – Southern Buoys (44017 and 44025) • Stronger warm biases than Northern Buoys • Weaker warm biases than Northern Buoys during night • Weak cool biases during day
TEMP BIASES – CMAN Stations (ALSN6 and BUZM3) • Mostly negative biases during day • Nighttime biases are variable between schemes • Biases similar to Southern Buoys
Cases with Model Spread?24-January-2011 BouLac scheme (negative bias)
Buoy/Tower Verification Conclusions • Mostly positive wind speed biases at surface during Warm Season • Weaker in South than North • BouLac scheme shows consistent negative wind speed bias during Cool Season • Stronger negative daytime biases in wind speed during Cool Season at Southern Buoys compared to Northern Buoys • Negative daytime bias in wind speed just above surface during Warm Season • More marine boundary layer observations are needed
IMPOWR Field Campaign Improving the Mapping and Prediction of Offshore Wind Resources • Began Spring 2013 • Long-EZ Aircraft Flights • Instrumented towers • Sonic Anemometers • Temperatures • Humidities http://dendrite.somas.stonybrook.edu/IMPOWR/impowr.html
Long-EZ AIRCRAFT • 40 Hz Observations • 3D Winds • Temperature • Pressure • Humidity • GPS and Inertial Systems • Air-flow Probe AIMMS-20
Flight 16-May-2013 Porpoise Maneuvers 1000-980 hPa
Rapid Refresh Winds (kts) 1000 hPa 925 hPa
Summary • PBL errors over the coastal ocean vary by season, location, and time of day • IMPOWR Field Campaign for MBL • Aircraft Observations • Tower Observations NEXT STEPS • Run WRF for each flight case/PBL scheme • Winds, temperatures, moisture • Momentum Fluxes • Sensible and Latent heat fluxes • Turbulent Kinetic Energy • IMPOWR Field Campaign will continue Spring/Summer 2014
References Bougeault, P., and P. Lacarrere, 1989: PARAMETERIZATION OF OROGRAPHY-INDUCED TURBULENCE IN A MESOBETA-SCALE MODEL. Monthly Weather Review, 117, 1872-1890. Dvorak, M. J., E. D. Stoutenburg, C. L. Archer, W. Kempton, and M. Z. Jacobson, 2012: Where is the ideal location for a US East Coast offshore grid? Geophys. Res. Lett., 39. Garratt, J. R., 1992: The Atmospheric Boundary Layer, Cambridge University Press, 316 pp. Hong, S. Y., Y. Noh, and J. Dudhia, 2006: A new vertical diffusion package with an explicit treatment of entrainment processes. Monthly Weather Review, 134, 2318-2341. Janjic, Z. I., 2001: Nonsingular implementation of the Mellor-Yamada level 2.5 scheme in the NCEP Meso model. Technical report, National Centers for Environmental Prediction: Camp Springs, MD, USA. Nakanishi, M., and H. Niino, 2006: An improved mellor-yamada level-3 model: Its numerical stability and application to a regional prediction of advection fog. Boundary-Layer Meteorology, 119, 397-407. Pleim, J. E., 2007: A combined local and nonlocal closure model for the atmospheric boundary layer. Part I: Model description and testing. J. Appl. Meteorol. Climatol., 46, 1383-1395. Shimada, S., T. Ohsawa, S. Chikaoka, and K. Kozai, 2011: Accuracy of the Wind Speed Profile in the Lower PBL as Simulated by the WRF Model. Sola, 7, 109-112. Shin, H. H., and S. Y. Hong, 2011: Intercomparison of Planetary Boundary-Layer Parametrizations in the WRF Model for a Single Day from CASES-99. Boundary-Layer Meteorology, 139, 261-281. Sukoriansky, S., B. Galperin, and V. Perov, 2006: A quasi-normal scale elimination model of turbulence and its application to stably stratified flows. Nonlinear Process Geophys., 13, 9-22. Suselj, K., and A. Sood, 2010: Improving the Mellor-Yamada-Janjic Parameterization for wind conditions in the marine planetary boundary layer. Boundary-Layer Meteorology, 136, 301-324.
Calculation of Turbulent Quantities Turbulent Kinetic Energy Vertical Momentum Fluxes Sensible and Latent Heat Fluxes Full TKE Budget Equation (Garratt 1992)