Download
1 / 33
330 likes | 352 Views
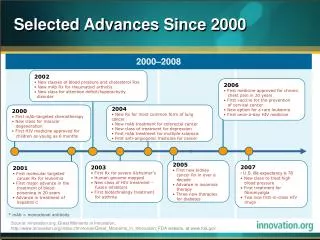
Explore changes in students' performance in reading, math, and science since 2000, comparing trends, top performers, and equity considerations. Analyze data on how various countries have evolved in the PISA assessment.

E N D
Programme for International Student Assessment Learning Trends Changes in student performance since 2000 Maciej Jakubowski Analyst, Indicators and Analysis Division, Directorate for Education, OECD
Trends: monitoring performance over time • Monitoring reading performance since 2000 • Similar reading assessment frameworks • Reading framework was only slightly updated since 2000 to include digital reading • A pool of test questions common to all PISA assessments • 39 identical items were used in both 2000 and 2009 • 26 identical items were used across all reading assessments • Identical sampling procedures • Additional checks to assure comparability of the results • Results adjusted for demographic changes and sampling modifications give nearly identical results • Results are consistent with non-scaled student responses (percentage of correct answers) • Trends in mathematics performance since 2003 • Trends in science performance since 2006
Change in reading performance between 2000 and 2009 Reading performance improved Score point change Reading performance declined
How countries perform in reading and how reading performance has changed since 2000 High performance Declining High performance Increasing Mean performance in reading 2009 Low performance Declining Low performance Increasing
Percentage of students below reading proficiency Level 2 2000 2009
Percentage of top performers in reading 2009 2000
Change in the share of boys and girls who are low performers in reading between 2000 and 2009 Share of students below proficiency Level 2 increased Share of students below proficiency Level 2 decreased
Different patterns of performance change among boys and girls
High reading performance High average performance Large socio-economic disparities High average performance High social equity Strong socio-economic impact on student performance Socially equitable distribution of learning opportunities Low average performance Large socio-economic disparities Low average performance High social equity Low reading performance
High reading performance . High average performance Large socio-economic disparities High average performance High social equity Strong socio-economic impact on student performance Socially equitable distribution of learning opportunities Low average performance Large socio-economic disparities Low average performance High social equity Low reading performance
High reading performance . High average performance Large socio-economic disparities High average performance High social equity Strong socio-economic impact on student performance Socially equitable distribution of learning opportunities Low average performance Large socio-economic disparities Low average performance High social equity Low reading performance
High reading performance High average performance Large socio-economic disparities High average performance High social equity Strong socio-economic impact on student performance Socially equitable distribution of learning opportunities Low average performance Large socio-economic disparities Low average performance High social equity Low reading performance
High reading performance High average performance Large socio-economic disparities High average performance High social equity Strong socio-economic impact on student performance Socially equitable distribution of learning opportunities Other rapid improvers in reading: Peru, Brazil, Indonesia Rapid improvers in mathematics: Mexico, Brazil, Turkey, Greece, Portugal, Italy and Germany Rapid improvers in science: Qatar, Turkey, Portugal, Korea, Brazil, Colombia, Italy, Norway, United States, Poland Low average performance Large socio-economic disparities Low average performance High social equity Low reading performance
Change in mathematics performance between 2003 and 2009 Mathematics performance improved Score point change Mathematics performance declined
How countries perform in mathematics and how mathematics performance has changed since 2003 High performance Declining High performance Increasing Mean performance in mathematics 2009 Low performance Declining Low performance Increasing
Percentage of students below proficiency Level 2 in mathematics 2003 2009
Change in science performance between 2006 and 2009 Science performance improved Science performance declined
How countries perform in science and how science performance has changed since 2006 High performance Declining High performance Increasing Mean performance in science 2009 Low performance Declining Low performance Increasing
Percentage of students below proficiency Level 2 in science 2006 2009
Percentage of top performers in science 2006 2009
Variability in student performance between and within schools Variation between schools Variance Variation within schools
Students’ view of climate for learningThe following things happen never, rarely or only in some lessons…
Thank you ! More on trends in PISA: Volume V, Learning Trends: Changes in student Performance since 2000 Find out more about PISA at… OECD www.pisa.oecd.org Email: Maciej.Jakubowski@OECD.org