Download
1 / 34
340 likes | 355 Views
Explore reliable methods for detecting tsunamis using geostationary satellites and transformations between tsunami representations. Investigate the limitations of existing systems and propose linear transformations for mapping tsunamis. Study different signal diagrams and wavelet decompositions to enhance tsunami detection.

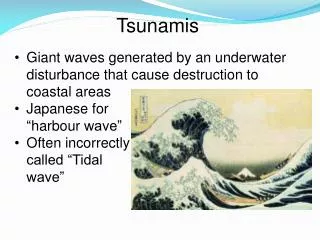
E N D
REPRESENTATION of TSUNAMIS in GENERALIZED HYPERSPACE Frank C. Lin* University of Maryland Eastern Shore, Princess Anne, MD. 21801, U.S.A. and Kingkarn Sookhanaphibarn** Ritsumeikan University,Kusatsu, Shiga,525-8577, Japan Email: *linbfrank@gmail.com **kingkarn@ice.ci.ritsumei.ac.jp IGARSS'11 SENDAI/VANCOUVER
PLAN of this TALK I. First, we recapitulate a previous study* in which a new, reliable, unequivocal, economical and instantaneous response method for DETECTING tsunamis at birth using TIR images from geostationary satellites; II. We show then the representations for tsunamis can be mapped into each other by a linear transformation. *Lin,F.C., na Nakornphanom, K.Sookhanaphibarn and Lursinsap, C: “A New Paradigm for Detecting Tsunamis by Remote Sensing”, InternationalJournal of Geoinformatics, Vol.6, No.1, March, 2010, p.19-30 IGARSS'11 SENDAI/VANCOUVER
Fig.1: The DART Method IGARSS'11 SENDAI/VANCOUVER
Shortcomings of the DART System I.Time Delay: Mentawai (2010), Tohoku (2011); II. Cost; III. Reliability; IV. Availability IGARSS'11 SENDAI/VANCOUVER
Fig.2: FY-2C 041226 0800 IR1 IGARSS'11 SENDAI/VANCOUVER
MAIN EVENT Fig.3: Signal along latitude 1067 (Banda Aceh) at 7 am Fig.4: Signal along latitude 1067 (Banda Aceh) at 8 am IGARSS'11 SENDAI/VANCOUVER
Fig.5: Wavelet Decomposition at Latitude 1067, 7 am Fig.6: Wavelet Decomposition at Latitude 1067, 8 am IGARSS'11 SENDAI/VANCOUVER
TABLE I. IGARSS'11 SENDAI/VANCOUVER
Fig.7: Earthquake Locations IGARSS'11 SENDAI/VANCOUVER
Fig.8: Signal from the Sumatra Aftershock at 09:00 a.m Fig.9: Signal from the Aftershock at 10:00 a.m IGARSS'11 SENDAI/VANCOUVER
Fig.10: Detail Decomposition of Aftershock Signal at 0900 and Latitude 1067 Fig 11 Detail : Decomposition of Aftershock Signal at 1000 andLatitude 1067 IGARSS'11 SENDAI/VANCOUVER
NOAA Pathfinder V - TIR Images IGARSS'11 SENDAI/VANCOUVER
Declouded IR images from the NOAA V5 Pathfinder satellite Fig 12: Detail Wavelet Decomposition of NOAA Night Image Fig.13: Detail Wavelet Decomposition of NOAA Day Image IGARSS'11 SENDAI/VANCOUVER
4.The Nicobar Island: (Location 3): Fig.14: Signal from the Nicobar Aftershock at 0900 LAT 1042 Fig.15: Signal from the Nicobar Aftershock at 1000 LAT 1042 IGARSS'11 SENDAI/VANCOUVER
Wavelet Decomposition,Nicobar Fig.16: Wavelet Decomposition at Nicobar at 0900 LAT 1042 Fig.17: Wavelet Decomposition at Nicobar at 1000 LAT 1042 IGARSS'11 SENDAI/VANCOUVER
CASE 1:ANDAMAN-1 and ANDAMAN-4 LAT 1012: (Location 4 &7): FIG.18: ANDAMAN-1 & 4 Signal 0600 LAT 1012 Fig.19: Wavelet Decomposition of ANDAMAN-1 & 4 at 0600, LAT 1012 IGARSS'11 SENDAI/VANCOUVER
ANDAMAN-4 0700 LAT 1012 Fig.:20: Signal for ANDAMAN-4 0700 LAT 1012 Fig.21: Wavelet Decomposition for ANDAMAN-4 0700 LAT 1012 IGARSS'11 SENDAI/VANCOUVER
At 0800, another tsunami signal is detected at the Andaman-1 epicenter Fig.22: Signal for ANDAMAN-1 0800 LAT 1012 Fig.23: Wavelet Decomposition for ANDAMAN-1 0800 LAT 1012 LON 978 IGARSS'11 SENDAI/VANCOUVER
CASE 2: ANDAMAN-2, LAT 978: (Location 5): Fig.24: Satellite Photo of Epicenter for ANDAMAN-2 0800 LON 958 IGARSS'11 SENDAI/VANCOUVER
No Tsunami Cases: Fig.25: Signal for ANDAMAN-2 0700 LAT 978 Fig.26: Wavelet Decomposition of ANDAMAN-2 0700 LAT 978 IGARSS'11 SENDAI/VANCOUVER
No Tsunami Cases: Fig. 27: Signal of ANDAMAN-2 0800 LAT 978 LON 958 Fig.28: Wavelet Decomposition for ANDAMAN-2 0800 LAT 978 IGARSS'11 SENDAI/VANCOUVER
CASE 3: ANDAMAN-3,LAT 965(Location 6): Fig.29: Signal for ANDAMAN-3 10:56 LAT 965 Fig:30: Wavelet Decomposition for ANDAMAN-3 10:56 LAT 965 IGARSS'11 SENDAI/VANCOUVER
ANDAMAN-3 Lat.965 11:29 (No Tsunami Signal) Fig.31: Signal for ANDAMAN-3 11:29 LAT 965 LON 955 Fig.32: Wavelet Decomposition for ANDAMAN-3 11:29 LAT 965 LON 955 IGARSS'11 SENDAI/VANCOUVER
Tsunami Magnitude & Intensity Mt = log2 (S) (1) where • Mt = Infrared Tsunami Magnitude, S = Tsunami Signal at the epicenter. Intensity: It = log2(√2 * S) (2) IGARSS'11 SENDAI/VANCOUVER
Infrared Tsunami vs Earthquake Magnitude Me = 9.2299 - 0.0592*log2(S) (3) IGARSS'11 SENDAI/VANCOUVER
Tsunami Index I I = 1000*log2-1(S)-110 (4) IGARSS'11 SENDAI/VANCOUVER
Earthquake vs Infrared Tsunami Index at Epicenter IGARSS'11 SENDAI/VANCOUVER
System Modules • Satellite Receiver Computer • PMEL • Visualization Monitoring Alarm IGARSS'11 SENDAI/VANCOUVER
Representations of Tsunamis: Signal Diagram (Canonical Representation); Wavelet Diagram; Vector Representation; Phase Space Representation (MOST etc.); Other. IGARSS'11 SENDAI/VANCOUVER
The Vector Representation We can represent a tsunami by a vector , with the components x, y, z, t, Me, Mt and Px (pixel brightness). IGARSS'11 SENDAI/VANCOUVER
Phase space (Iida) & Infrared Space (Lin) Representations Iida Equation: Mt = 2.61*Me – 18.44 Lin et al : Mt = 9.2299–0.0592*Me IGARSS'11 SENDAI/VANCOUVER
Linear Transformation Define abbreviated vector vIR = (Me, MtIR, N) and vP = (Me, MtP, N), while all other variables are held constant, and N is an axis orthogonal to the Me-Mt plane. Then vP = R * vIR + TMe + TMt where IGARSS'11 SENDAI/VANCOUVER
CONCLUSION The advantages of our method vis-à-vis DART are: its economy, itsreliability, its greater availability, and its instantaneous response time. Our procedure can be incorporated into an early warning system which potentially can save lives and property. IGARSS'11 SENDAI/VANCOUVER
Questions, Comments?? IGARSS'11 SENDAI/VANCOUVER