Download
1 / 54
540 likes | 697 Views
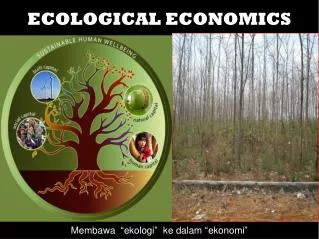
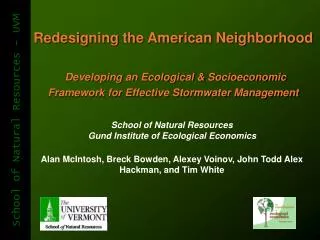
Introduction to Ecological Economics Greentax Sep. 7, 2004 Gary Flomenhoft-Gund Institute. CIRCULAR FLOW MODEL OF ECONOMY. “EXTERNALITIES” SOCIETY . ?. ECONOMY. ?. ENVIRONMENT. Environment as subset of ECONOMY. NEO-CLASSICAL ECONOMICS 1890-. No Ingredients, only labor and capital

E N D
Introduction to Ecological Economics Greentax Sep. 7, 2004 Gary Flomenhoft-Gund Institute
CIRCULAR FLOW MODEL OF ECONOMY “EXTERNALITIES” SOCIETY ? ECONOMY ? ENVIRONMENT
NEO-CLASSICAL ECONOMICS 1890- No Ingredients, only labor and capital P = f(L,K)= ALa. BKb (Cobb-Douglas multiplication) Labor (Chef ) = x Bread? X Capital (oven) Capital (Mixing bowl)
NEO-CLASSICAL ECONOMICS INFINITE SUBSTITUTABILITY: 2P = f(L,K)= 2ALa. 2BKb More Chefs x = More Bread? or Bigger Mixing bowl
Quotable Quotes • “There is no reason we can’t have a perfectly healthy economy with virtually no resources whatsoever” Robert Solow • “We can do without agriculture because it’s only 2% of the economy.” Norgaard? • “neo-classical economics is a form of brain damage” -- Hazel Henderson
ECOLOGICAL ECONOMY NO “EXTERNALITIES”
Intro to Ecological Economics Throughput-open system 1st Law: Conservation of mass (some) (waste) ECONOMY
GREEN TAX SOURCES (some) ECONOMY (waste) 3 Ss: Sources Sub-surface Resources Sites Surface locations: ie: land Sinks Absorbtion of waste
Intro to Ecological Economics Entropy=disorder, randomness 2nd Law: entropy always increases (waste) ECONOMY (dissipated) LOW ENTROPY HIGH ENTROPY
Intro to Ecological Economics WHAT IS ANTI-ENTROPIC? (SYNTROPIC) (waste) ECONOMY LOW ENTROPY HIGH ENTROPY
Intro to Ecological Economics Throughput-closed system earth ECONOMY
SCALE-Full World or Empty World? Source: Ecological Economics Principles & Applications, Farley and Daly
Sky-Trust model (some) ECONOMY (waste) Sources Sub-surface Resources GO UPSTREAM!
Sky-Trust model Appendix : Key Features of U.S. Sky Trust Here are the key features of the proposed U.S. Sky Trust. o Carbon emissions cap set initially at 1.346 billion tons, the 1990 level o Tradable carbon emission permits sold annually to energy companies at the top of the carbon chain. o All revenue from permit sales goes into a nationwide trust. o Trust pays equal annual dividends to all U.S. citizens (like the Alaska Permanent Fund). o Dividends can be placed tax-free in Individual Retirement Accounts or Individual Development Accounts for children. o Initial price ceiling on carbon emission permits of $25 a ton; ceiling rises 7 percent a year for four years. o Transition Fund to help those most adversely affected by higher carbon prices. Fund starts at 25 percent of permit revenue, declines 2.5 percent per year.
“Golden Rule of Publicly held companies: “Maximization of Shareholder Value” Rational behavior: Externalize costs Influence politics to Seek subsidies and favors “Invisible boot”
Quotable Quotes “Altruism is evil and selfishness is a virtue.” -Ayn Rand “Few trends could so thoroughly undermine the very foundations of our free society as the acceptance by corporate officials of a social responsibility other than to make as much money for their stockholders as possible.” -Milton Friedman 1962 Enron, World Com, Tyco????
Cost of regulations-OMB report Annual Cost: $37-43 billion EPA conservative approach, Consistently overestimates costs, not considering least cost approach and technical innovation Annual Benefits: $121-193 EPA consistently underestimates benefits USING ACTUAL NOT THEORETICAL CASES BENEFITS OUTWEIGH COSTS 5:1
CONSILIENCE “~Resources are infinite and the economy can grow forever” -Julian Simon “Anyone who thinks you can have infinite growth on a finite planet is either a madman or an economist” Kenneth Boulding
Intro to Ecological Economics Throughput-isolated system Universe
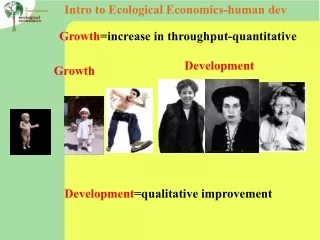
Intro to Ecological Economics-human dev Growth=increase in throughput-quantitative Development Growth Development=qualitative improvement
Intro to Ecological Economics-population Demographic transition Theory Development Growth
Intro to Ecological Economics-forest succession Development Growth Reorganization Aggredation Transition Steady-state (mature)
We hear: “There is no conflict between economic growth and environmental protection!”
GDP 1825: ~$200 BILLION 2000: $41,000 B ILLION OR $41 TRILLION =205X 1825 level.
ESA Listings and GDP $10 $9 $8 $7 $6 $5 $4 $3 R2 = 98.4 1973 1980 1990 2001 Source: The Wildlife Society Technical Review 2003-1.
Urbanization Agriculture Water diversions (e.g., reservoirs) Recreation, tourism development Pollution Domestic livestock, ranching 247 205 160 148 143 136 Endangerment Causes Czech et al. 2000. Bioscience 50(7):593-601.
Mineral, gas, oil extraction Non-native species Harvest Modified fire regimes Road construction/maintenance Industrial development 134 115 101 83 83 81 Causes (cont.) Czech et al. 2000. Bioscience 50(7):593-601.
Carrying Capacity Scenarios K K-selection Individuals r-selection Time
K Natural capital allocated to wildlife GNP Natural capital allocated to human economy Time Czech, B. 2000. Economic growth as the limiting factor for wildlife conservation. Wildlife Society Bulletin 28(1):4-14.
Natural Capital “We treat the earth like a business in liquidation.” Herman Daly Opportunity cost. Loss is not counted.
(OVERSHOOT) Economic Carrying Capacity (“Plimsoll line”) K K-selection GNP r-selection Time
We Might Ask K What happens here? Economy of nature GGP Human economy
American GNP, 1929-1997 K or r-selected?
Natural Capital Allocation Revisited KU X natural capital allocable KT Natural capital allocated to non-human economy GNP Natural capital allocated to human economy Time