Download
1 / 27
300 likes | 538 Views
Coexistence climate analysis of the late Eocene Florissant flora, Colorado. Aly Baumgartner GeoCorps Intern Herb Meyer Paleontologist Florissant Fossil Beds NM. Florissant Fossil Beds. 34.07 ± 0.10 Ma Late Eocene Lake Florissant Plant fossils ~140-150 plant species

E N D
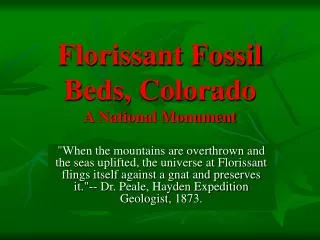
Coexistence climate analysis of the late Eocene Florissant flora, Colorado Aly Baumgartner GeoCorps Intern Herb Meyer Paleontologist Florissant Fossil Beds NM
Florissant Fossil Beds • 34.07 ± 0.10 Ma • Late Eocene • Lake Florissant • Plant fossils • ~140-150 plant species • 7 extinct genera, all families extant • Mixed broadleaved deciduous/broadleaved evergreen/ coniferous forest • Insect, vertebrate fossils
Previous Paleoclimate Work • Nearest living relative (NLR) • Leaf physiognomy/CLAMP • Weighted-averaging partial least-squares regressions (WAPLS) • Family and genus levels • MAT range: 10°C -18°C (Gregory, 1994a; MacGinitie, 1953, Boyle et al., 2008)
Florissant Formation (Zachos et al., 2008)
Coexistence Approach • Uses nearest living relative’s recent distribution and climatic requirements (Mosbrugger and Utescher, 1997; palaeoflora.de)
Coexistence Approach • Which taxa? • Only included previously described taxa identifiable as extant genera • Eocene requires generic level (too old for species) • Outlier taxa for any parameter completely removed from analysis • Which parameters? • Mean annual temperature (MAT) for comparison to previous studies
Coexistence Approach • Which databases? • Initially, PalaeofloraDatabase • Subsequently, obtained climate data from alternate sources • Relations Between Climatic Parameters and Distributions of Trees and Shrubs, North America. (Thompson et al., 2000) • Atlas of Woody Plants in China: Distribution and Climate Volume I (Fang et al., 2011)
Coexistence Approach • Pros • Can be used on any plant organ • Some misidentifications may be eliminated as outliers • Cons • Possible misidentification of fossils • Possible incorrect NLR • Extinct genera • Climatic tolerances changed due to evolution • Especially older fossils
Sources • The Fossils of Florissant by Herbert W. Meyer(Appendix) • Florissant Fossil Database • Summary of current valid taxa • Macrofossils and pollen • Includes dubious identifications • Fossils from all stratigraphic units, undifferentiated (Meyer, 2003; http://planning.nps.gov/flfo/)
Sources • Evolutionary trends and ecological differentiation in early Cenozoic Fagaceae of western North America • Johannes Bouchal, ReinhardZetter, FridgeirGrimsson, and Thomas Denk, 2014 • Pollen sample from single stratigraphic unit (Bouchal et al., 2014)
Sources • Higher taxa as paleoecological and paleoclimatic indicators: A search for the modern analog of the Florissant fossil flora • Brad Boyle, Herb Meyer, Brian Enquist, Silvia Salas, 2008 • Taxa evaluated by Estella Leopold, Steven Manchester and Herb Meyer • List of “confidently recorded” plant taxa • Pollen and macrofossils • Represent all stratigraphic units, undifferentiated (Boyle et al., 2008)
Fossils of Florissant: Macrofossil No Outliers 14.4-17.6°C
Fossils of Florissant: Pollen 15.7-19.4°C
Bouchal et al.: Pollen 17-19.4°C
Boyle et al.: Macrofossil Taxa 10.6-17.5°C
Boyle et al.: Pollen Taxa 15.7-19.4°C
Boyle et al.: Macrofossil Supplemental 10-13.2°C *Atlas of Woody Plants in China **Relations Between Climatic Parameters and Distributions of Trees and Shrubs, North America
Pollen Problems • High-elevation paleo pollen assemblages problematic • Likely to have warm, low elevation pollen influx • Less likely to have cool, high elevation pollen influx • Taxa such as Ephedra can disperse >1,000 km • Pollen reconstructions tend to be warmer and wetter than those with macrofossils • Macrofossil reconstructions preferred (Maher, 1964; Ortu et al., 2006)
Comparisons to previous studies Pollen Macrofossils
Comparisons to previous studies NLR WAPLS CLAMP/Leaf physiognomy
Coexistence Approach Critique • Precision and accuracy of climate data matter! • Demonstrated assumed precision 0.1° C inaccurate • Palaeoflora Database precision stated ≤ 5°C • Important lower limits • All roads lead to Carolina • 560/700 taxa at 16° C • Relict taxa • Sequoia, Eucommia? • Genus v. species (Grimm and Denk, 2012)
Questions and Concerns • Why use multiple sources? • To combat bias from single sources • To include more taxa, narrower climate resolution • What about outliers/taxa not included in analysis? • Focused on MAT, fewer outliers • Confidently identified had fewer outliers • Many excluded taxa relictual • Larger range in Eocene
Conclusions • Pollen and macrofossil analyses differ • Pollen analyses give warmer results • At high elevation, macrofossil analyses probably more accurate • MAT: 10-13.2°C • Overlaps with previous macrofossil analyses • Cooler than analyses including pollen
Acknowledgements • David Greenwood for modern climate data and additional resources • GeoCorps America for research opportunity • The National Park Service and Florissant Fossil Beds National Monument for resources • Experiment and all my supporters for getting me to GSA