Download
1 / 22
220 likes | 386 Views
Minnesota Nutrient Management Initiative. On Farm Evaluation of Nitrogen and Phosphorous Nutrient Management. Nutrient Management Initiative. New program sponsored by USDA Natural Resources Conservation Service (NRCS) and Rural Advantage

E N D
Minnesota Nutrient Management Initiative On Farm Evaluation of Nitrogen and Phosphorous Nutrient Management
Nutrient Management Initiative • New program sponsored by USDA Natural Resources Conservation Service (NRCS) and Rural Advantage • Farmers working with certified crop consultants to evaluate current nutrient management to guidelines recommended by Minnesota (NRCS); • Uniform approach over a broad geographical area comparing different nutrient management practices and evaluating economic outcomes; • To assist NRCS in evaluation of current nutrient management guidance and adjust future guidelines
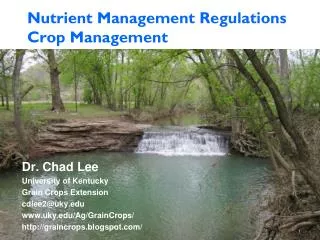
South Central Nitrogen Best Management Counties Eligible Watersheds Blue Earth River Redwood River Root River Eligible Areas of the State
Nutrient Management Initiative—Design • Either nitrogen or phosphorous site • 2 Rates replicated 3X • (N plots require 2—0 rate checks) • No manure or alfalfa history for past 5 years • High and very high testing phosphorous fields are eligible • Farmer required to work with a Certified Crop Adviser: • demonstration set-up, recommendations, recordkeeping, & harvest data
Nutrient Management Initiative—Design • Corn-soybeans or corn-corn rotations • Minimize variables—keep all cropping practices identical except phosphorous or nitrogen applications • Field uniformity desired—soil variability perpendicular to rows
Nutrient Management Initiative—Design • Recent soil test required • Sites will be evaluated for soil test changes & yield impacts over time • Strip size—minimum of 40’ wide by minimum of 600’ long • Harvest—1 combine swath per 40’ • Weigh wagon—future yield monitor??
Nitrogen Design 0 Rate Strip 100’-200’ X 1 swath width 0 Rate Strip 100’-200’ X 1 swath width
Allow 30 pound N rate difference. Use one of the following treatment A (NRCS Strip) options:
Phosphorous Design • High or very high testing phosphorus soils • Soil test >16 ppm Bray &/or 12 ppm Olsen • Must keep N rate constant
Nutrient Management Initiative Demonstrations 180# /Acre Total N 208#/A 150#/Acre Total N 178.5 #/A Corn on Corn 0#/A Rate
Corn following Corn Corn following Corn Application Rate AverageYield Check (0 Rate) 122.1 Bu./A 208#/A (Fall Applied 180#/A) 155.4 Bu./A 178#/A (Fall Applied 150#/A) 157.0 Bu./A
Nutrient Management Initiative Demonstrations Plot Set-up Corn following Soybeans 100#/A Fall NH3 Total N 136#/A 145#/A Fall NH3 Total N 181#/A 0 Rate Check 100-200’
Corn following Soybeans Application Rate AverageYield Check (0 Rate) 135.4 Bu./A 136#/A (Fall Applied 100#/A) 179.5 Bu./A 181#/A (Fall Applied 145#/A) 185.2 Bu./A
Payment and Data Submittal • Farmer receives $1200 for participation • Farmer required to work with Certified Crop Adviser • Crop Adviser assists with establishment & validates results • Certified adviser and farmer determine method and amount of reimbursement for his or her services. • Cropping information submitted by July 1st • Harvest information submitted by December 1st
Maintenance Sitesfollowing year soybeans • Evaluate following year soybean yields from prior year N or P applications • Phosphorous sites • Farmer allowed to follow normal P management on farmer selected strips • NRCS guidelines = 0 • Farmer will be compensated $600 • Yield data submitted
Nutrient Management Initiative Data Review • Farmers identity kept confidential • Farm results used as a pool of data • Farm Business Management will evaluate economics • Farmers will receive an economic summary • Based on actual N or P costs and base value for corn • Educational meeting to review outcomes (February 2007)
2006 Nutrient Management Initiative Sites = University of Minnesota Replicated multi-rate N Plots 6 sites = NMI Plots—21 sites
2006 Nutrient Management Sites • 18 Nitrogen Sites • 9 corn following corn—168#/A v.s. 202#/A (34) • 9 corn following soybeans—122#/A v.s. 160#/A (38) • 3 Phosphorous Sites • 1 site following corn—2 sites following soybeans • NRCS rate—3.6 P205 • Farmer rate—53 P205
Remember!! • Must submit producer agreement prior to participation • Must complete anticipated nutrient application information • Information at:http://www.mda.state.mn.us/nmi/newagreement.pdf
Conclusions: • Nutrient Management Initiative provides a framework empowering farmers and consultants to evaluate agronomic performance • On-farm demonstrations assist farmers and consultants with fine tuning fertility programs • Maintain and/or increase crop yields & profitability • Increased fertilizer prices—Can we better manage the last 30#-40# of N applied??? • Evaluate nutrient management & BMP’s over a larger geographical area • Data generated will assist NRCS with nutrient management guidance
How many bushels of corn does it take to pay for an additional 30# of N/acre? For example, if you purchase N at an average price of .35/lb and sell your corn for $3.00/bushel you will need to see a yield increase of at least 3.5 bushels/acre to break even for that extra #30/acre of applied nitrogen fertilizer.