Download

1 / 13
130 likes | 284 Views
NOAA Science on a Sphere User’s Collaborative Network Workshop. NOAA IDEA Center Lynn Nakagawa Honolulu, Hawaii July 29, 2008 - July 30, 2008. NOAA IDEA Center. Where do we fit? Organizationally: NOAA/NESDIS/NCDC but with a NOAA-wide mission Relevant NOAA Mission Goals :

E N D
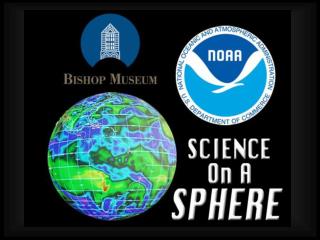
NOAA Science on a SphereUser’s Collaborative Network Workshop NOAA IDEA Center Lynn Nakagawa Honolulu, HawaiiJuly 29, 2008 - July 30, 2008
NOAA IDEA Center • Where do we fit? • Organizationally: NOAA/NESDIS/NCDC but with a NOAA-wide mission • Relevant NOAA Mission Goals: • Understand Climate Variability and Change to Enhance Society’s Ability to Plan and Respond • Serve Society’s Needs for Weather and Water Information (risk management) • Protect, Restore and Manage the Use of Coastal and Ocean Resources (marine & coastal ecosystems) • NOAA Functional Activities: • Monitor and Observe (GCOS, GOOS, PacIOOS) • Assess and Predict (climate as an initial focus) • Engage, Advise and Inform (integrated environmental data products and information services)
An Initial Program Element Development of new integrated data products and environmental applications, and supporting high priority regional and NOAA needs for enhanced information on: Climate vulnerability and adaptation Coastal and marine ecosystems Hazards risk management
Data Integration and Visualization: Pacific Region Integrated Climatology Information Products (PRICIP) Analyze patterns and trends of storm frequency and intensity - “storminess”- in historical records collected throughout the Pacific region; integrate the results of these analyses; and develop a suite of information products that can be used by emergency managers, mitigation planners, and other decision-makers.
PRICIP Tailored Information Products Hurricane Iniki September 5-13, 1992 • NOWCASTS • FORECASTS • FUTURECASTS • HINDCASTS At 3:30 pm HST, the eye of Iniki crossed the south coast of Kauai and departed on the north coast about 40 minutes later. Estimated maximum sustained winds over land were 140 miles per hour with gusts as high as 175 miles per hour, making INIKI the most powerful hurricane to strike the Hawaiian Islands in recent history… Impacts o 6 Deaths o 100+ Injured o 14,356 Homes damaged or destroyed o 4 weeks after the storm only 20% of the residents had power Climatology Winds sustained - 140 mph gusts - 175 mph Historical “Event Anatomies” * * This mock-up contains information from NOAA and other sources.
Sea Level Stations A Tsunami Focused Data Sharing Framework Project Goals • Expose Sea Level Station MetaData • --Data schema • -- Semantic (Plain English) • -- Formal XML Schema (XSD) • Harvest WWL Data • --Remote Procedures Specification • --Web Service Desc Language (WSDL) • --Prototype Implementation
Google Earth sealevelstations.org
Touch Table GIS data: Drought Monitor GOES Satellite NEXRAD Radar The Weather and Climate Toolkit: http://www.ncdc.noaa.gov/oa/wct/ Shapefile GeoTIFF KMZ Formats used b ArcGIS & Google Earth
Contact Info PRICIPpricip.orgJohn Marrajohn.marra@noaa.govSea Level Stationssealevelstations.orgUday Kariuday.kari@noaa.govLynn Nakagawalynn.nakagawa@noaa.gov(808) 944-7432