Download
1 / 10
100 likes | 135 Views
Learn how CBS in Namibia utilizes GIS for census mapping, emergency responses, and improved service delivery, enhancing spatial analysis.

E N D
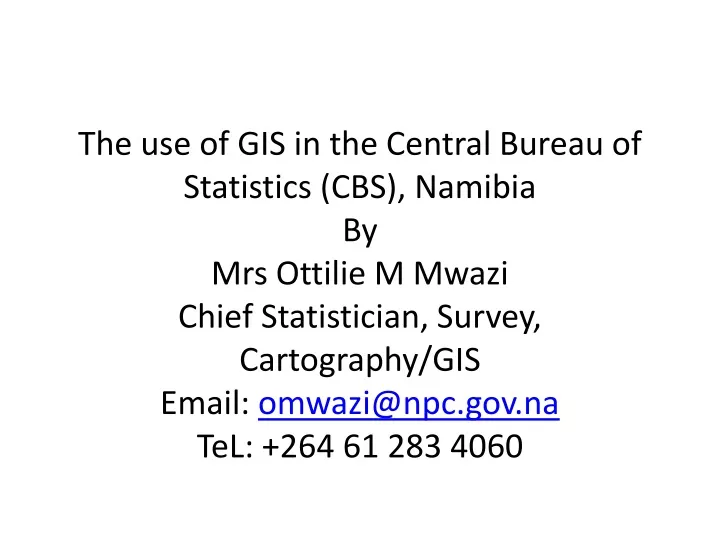
The use of GIS in the Central Bureau of Statistics (CBS), NamibiaByMrs Ottilie M MwaziChief Statistician, Survey, Cartography/GISEmail: omwazi@npc.gov.naTeL: +264 61 283 4060
Administrative set up Namibia has a land area of about 824 000 square kilometers The country is divided into 13 regions Regions are divided into constituencies (107 in total for all regions) The biggest region has 12 constituencies Constituencies are demarcated based on population size EAs are demarcated within constituencies
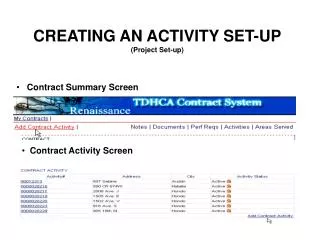
Implementation of GIS at CBS • GIS was implemented for 2001 census mapping to produce digital maps for 2001 census enumeration • Data warehouses using existing spatial data from various sources were created • Spatial data needed for census undertaking was extracted and GIS database was created • The GIS has made it possible to retrieve, update, link (census/survey data to the geography), query the database, print maps on based on any theme, etc. • GIS Tool was created up to constituency level
2001 Census Mapping • The country was demarcated into unique geographical areas known as enumeration areas • GPS (handheld and differential) were used during fieldwork • GIS was used to delineate EAs boundary
GIS and 2011 census mapping PROCESS: A summarized process of 2011 Census mapping methodology Step 1 Step 2 Step 3 Step 4 Aerial photographs/ satellite images acquired Structures captured from images in GIS in the office Un-verified dwelling unit frame created and EAs demarcated Field maps with dwelling unit numbers produced Step 5 Step 6 Step 7 Step 8 Field workers sent in the field to capture the location of, & other information relating to, all the dwelling units in country using PDAs Captured information will be verified and stored in a GIS database, and a verified Dwelling Unit Frame will be created Demarcation of EAs will be done in the office. Final EA maps for 2011 Population & Housing Census enumeration will be produced
Why dwelling frame • Know where people live: • It will be useful for Flood Early Warning System • Will be easy to plan for safe water provision • Easy to identify communities that walk longer distance to public services (Clinics, School, etc) • Easier to update dwelling units than households • Improve data dissemination at lower geographical areas • Serve our clients better who are planning using other boundaries e.g. Health, Police, Headmen/Chiefs traditional authorities, etc. • Will be easier to estimate population if updated regularly
GIS and emergency responses • With GIS, and dwelling frame in place we will be in position to spatially visualize dwellings affected by flood: • This will ensure for effective and efficient emergency response • It will also be possible to quantify the number of people, households and homestead affected by flood.
GIS and basic services delivery • With GIS, and dwelling frame in place we are now in position to spatially visualize gaps in access to basic services (health facilities, schools, clean water) : • Therefore, GIS will play a major role in the process of planning and locating of new basic facilities
GIS and spatial analysis With GIS, we could geo-statistically analyze the pattern of Human Development Index (HDI) and map out the outliers and clusters Human Development Index We could also map out the hot and cold spots of HDI
End of presentation Thank you for your attention!!