Download
1 / 35
350 likes | 468 Views
Review for Midterm 3. What we have discussed after Midterm 2. Tropical cyclones Airmasses , fronts, and mid-latitude cyclones Tropical and e xtratropical climate Weather and climate prediction (Not required) Heat island effect (Not required ) Air pollution (Not required)

E N D
What we have discussed after Midterm 2 • Tropical cyclones • Airmasses, fronts, and mid-latitude cyclones • Tropical and extratropical climate • Weather and climate prediction (Not required) • Heat island effect (Not required) • Air pollution (Not required) • Observed global climate change • Projection of future climate change • Feedbacks and abrupt climate change (Not required) • Mitigation of global climate change
Standard units of measurementSI (System International) Quantity Name Units Symbol Length meter m m Mass kilogram kg kg Time second s s Temperature Kelvin K K Density kilogram kg/m3 kg/m3 per cubic meter Speed meter per m/s m/s second Force newton m.kg/s2 N Pressure pascal N/m2 Pa Energy joule N.m J Power watt J/s W
Scientific Notation nano one-billionth 10-9 0.000000001 micro one-millionth 10-6 0.000001 milli one-thousandth 10-3 0.001 centi one-hundredth 10-2 0.01 deci one-tenth 10-1 0.1 deka ten 101 10 hecto one hundred 102 100 kilo one thousand 103 1000 mega one million 106 1000000 giga one billion 109 1000000000 … yotta 1024
Tropical cyclones • Tropical cyclone genesis: Western Pacific has the highest averaged number per year. 6 necessary conditions. 4 stages. • Tropical cyclone structure: 3 major components, rotation direction of inflow and outflow, location of maximum wind and rainfall, 3 feedbacks • Tropical cyclone intensity scale. Category 1: 74mph, category 5: 155mph • Hurricane names: alphabetically, 6 lists in rotation • Trends and variability in tropical cyclone activity • Tropical cyclone destruction: 4 reasons. Which side has the most intense destruction? • Tropical cyclone forecast: track and intensity. Currently which skill is better?
Necessary conditions for tropical cyclone formation • SST > 27 oC(Poleward of about 20o SST too cold for formation. Highest frequency in late summer to early autumn when water is warmest.) • Warm ocean mixed layer is thick enough to supply energy (this is why they weaken quickly upon landfall) • Unstable atmosphere with a moist lower/middle troposphere (central and western ocean basins) • Low vertical windshear(Otherwise upward transfer of latent heat disrupted) • Coriolis force (hurricanes do not form between 5N-5S) • Pre-existing low-level rotating circulations (tropical waves and other disturbances)
Structure of tropical cyclones • Size and lifetime: about 600km, last up to a week or more • Make up: many thunderstorms arranged in pinwheel formation • Three components: • 1. Central eye - clear skies, light winds (25 km diameter) • 2. Eye wall - maximum rainfall and wind speed. • 3. Spiral rainbands • Cylonic inflow, anticyclonic outflow.
Tropical cyclone Destruction and Fatalities • Destruction caused by: • Hurricane-scale winds (>74 mph) • Rainfall (10 in/day) • Storm surge (winds blowing coast-ward + lower atmosphere pressure) • Fine-scale Tornadoes • Destruction most intense on right side of cyclone (wind + storm speed)
Airmasses, fronts, and mid-latitude cyclones • Definition of airmasses. Bergeron classification of air masses (3 letters). • Fronts: 6 types (cold, warm, stationary, occluded, dry line, squall line) • Cold front (narrow, fast, heavy precipitation), Warm front (wide, slow, light precipitation) • The developmental stages and vertical structure of middle latitude cyclones (boundary between northern cold air and southern warm air, upper level low to the west of surface low) • How upper level longwaves and shortwaves may enhance cyclonic development at the surface (upper level low to the west of surface low) • The three regions of cyclogenesis and typical tracks
Bergeron classification of air masses • 3 letters: e.g. mTk, cPw • 1st letter for moisture properties: c - continental, m - maritime • 2nd letter for thermal characteristics: T - tropical, P -polar, A - Artitic/Antarctic, M - monsoon, E - equatorial, S -superior air(dry air formed by significant downward motion in the atmosphere) • 3rd letter for stability: k/w - air colder/warmer than ground
Fronts • A weather front is a boundary separating two air masses • Types: cold front, warm front, stationary front, occluded front, dry line, squall line • Cold front (steep, narrow, fast, heavy precipitation), • Warm front (less steep, wide, slow, light precipitation)
How does a mid-latitude cyclone form? In mid-latitude there is aboundary between northern cold air and southern warm air In the boundary an initial cyclone can advect warm air northward and cold air southward If theupper level low is to the west of surface low, the cyclone will amplify and precipitation will form. Mature stage. Cold air begins to catch up with warm air (occluded). Cold air cools down the cyclone. Dissipation.
Regions of cyclogenesis and typical tracks • Gulf of Mexico, east coast • Alberta Clipper from eastern side of Canadian Rockies • Colorado Low from eastern slope of American Rockies • Lee-side lows, lee cyclogenesis
Tropical and extratropical climate Tropical climate: • Mean state: The two basic regions of SST? Which region has stronger rainfall? What is the Walker circulation? • Mean state: Two types of ocean upwelling, ocean-atmosphere feedback • El Nino and La Nina: Which region has warm SST anomaly during El Nino? 4-year period. • Land-sea contrasts: seasonal monsoon Extratropical climate: • Mean state: westerly winds, polar vortex • What is the primary way El Nino affect extratropics? (Pacific/North American Oscillation) • The oscillations associated with strengthening/weakening of polar vortex: Arctic Oscillation, Antarctic Oscillation
Tropical mean state • Determined by east-west sea surface temperature contrast: Indo-Pacific warm pool, eastern Pacific cold tongue • Walker circulation, which interacts with underlying ocean and causes equatorial upwelling and coastal upwelling 2 basic regions Indo-Pacific warm pool Eastern Pacific cold tongue
is an oceanographic phenomenon that involves wind-driven motion of dense, cooler, and usually nutrient-rich water towards the ocean surface, replacing the warmer, usually nutrient-depleted surface water. Ocean upwelling • Equatorial upwelling: Due to Coriolis effect • Coastal upwelling: Due to Coriolis effect
El Nino/Southern Oscillation (ENSO): The 4-year oscillation • El Nino: Very warm sea surface temperature over central and eastern tropical Pacific, which occurs every 3-7 years. The Walker Circulation becomes disrupted during El Niño events, which weakens upwelling in eastern Pacific. • La Nina: the opposite condition to El Nino • Southern Oscillation: The atmospheric oscillation associated with the El Nino-La Nina cycle. • The whole phenomena is now called El Nino /Southern Oscillation (ENSO)
Land-Sea Contrast: Seasonal “Monsoon” • A seasonal reversal of wind due to seasonal thermal differences between landmasses and large water bodies (land-sea contrast) • Orographic lifting often enhances precipitation totals
Observed global climate change • 3 ways human activities affect the climate. • Rapid increase of greenhouse gases (CO2, CH4, N2O) since 1750: far exceed pre-industrial values determined from ice core measurements spanning the last 650,000 years, which is mainly caused by CO2 fossil fuel use. Lead to strong radiative heating. • The developed countries and developing countries contribute almost equally to the emissions of GHGs. • Observed change of mean: air temperature, ocean temperature, melting of arctic sea ice, Greenland ice sheet, snow and glaciers, rising of sea level. • Observed change of extreme events: extreme precipitation events, heat waves, strongest hurricanes
How do human activities change the global climate? Human beings are changing the global climate system in three different ways: • Release or cleanse greenhouse gases • Release or cleanse pollutants (aerosols) • Change land cover (deforestation and urbanization)
Observed change of greenhouse gases Global atmospheric concentrations of CO2 and CH4 have increased markedly as a result of human activities since 1750 and now far exceed pre-industrial values determined from ice core measurements spanning the last 650,000 years!
Global map of temperature change: Largest warming in Arctic (“Arctic amplification”)Larger warming over land than ocean
Retreat of Mountain Glaciers: a major contributor to sea level rise Glacier retreat is a world-wide phenomena. • Will affect water supply for millions: • Kenya/Tanzania • Northern India • Andes Mountains IPCC (2001)
Projection of future global climate change • Global climate models: Earth system models (5 components) • Global climate models can reproduce the observed warming in the 20th century. The warming is largely caused by human activities. • Projected change: mean temperature (largest warming over Arctic, larger over land), mean precipitation, sea level, extreme temperature, extreme precipitation, fresh water, ecosystems • Future climate scenarios show that reducing greenhouse gas emissions can substantially mitigate warming in the latter half of this century.
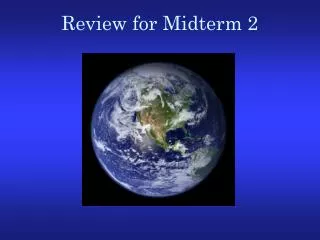
Framework of Earth System Model Atmosphere Biogeochemistry Coupler Sea Ice Ocean Land • Include 5 components:atmosphere, ocean, land, sea ice, biogeochemistry • Based on the conservation laws of mass, energy, momentum, water vapor and other chemical species (e.g. CO2, CH4) • Based on future assumptions of external forcing (GHG concentrations, solar variability, pollution, land use changes)
Can the GCMs Reproduce the 20th Century Temperature Trend? The GCMs can reproduce the 20th century temperature trend The warming is caused by anthropogenic forcings!
Global map of projected change Temperature: Largest warming over Arctic, larger over land Precipitation: Increase in tropics/poles, decrease in mid-latitudes
Impacts on ecosystems 4.0 3.0
Mitigation of global climate change • Rapid increase of greenhouse gases (CO2, CH4, N2O) since 1750 is mainly caused by CO2 fossil fuel use. • The developed countries and developing countries contribute almost equally to the emissions of GHGs. • Mitigation: International (Kyoto Protocol) • Green economy (Renewable energy, Sustainable transportation, Green buildings, Energy-efficient industry and carbon capture, Land management, afforestation, waste management) • We can make a difference by reducing waste of energy, food and other materials, and by purchasing environment-friendly products.
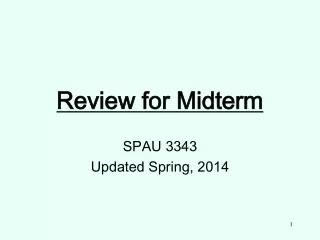
Greenhouse gas emissions per capita The developed countries and developing countries contribute almost equally to the emissions of GHGs.
International: Kyoto protocol • Negotiated in 1997. Commits parties to internationally binding emission reduction targets. • “Common but differentiated responsibilities” • Specific reduction targets for developed countries • Measures to slow the growth of emissions in developing countries • Non-parties: • Canada • USA • Andorra • South Sudan • Palestine • Vatican City
About Midterm 3 • There will be <50 multiple-choice questions