Download

1 / 18
180 likes | 302 Views
Scientific Method. Basic Parts of Scientific Method. Question/Problem Research Variables Hypothesis Materials Procedure Data/Analysis Conclusion. Question/Problem and Research. Purpose of performing the experiment, generally due to an observation Must be a “scientific” question

E N D
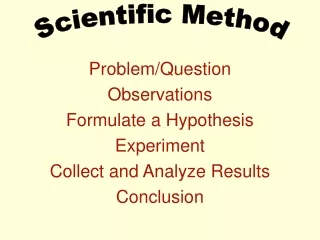
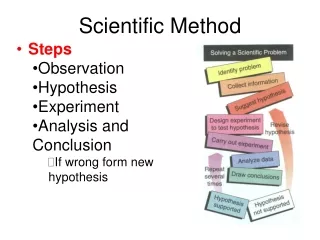
Basic Parts of Scientific Method • Question/Problem • Research • Variables • Hypothesis • Materials • Procedure • Data/Analysis • Conclusion
Question/Problem and Research • Purpose of performing the experiment, generally due to an observation • Must be a “scientific” question • Precise and based on an observation • Answered through research, experiments, observations • Research for background information • Find out what other scientists have discovered • May lead to a hypothesis
Variables • Any factor that can affect the outcome of an experiment • There are three types control, independent, and dependent variables • Control variables are the factors that are kept constant for the experimental and control group
Variables cont Independent variable • There can only be one for the experiment to be valid • It is the factor that you change • Sometimes called the manipulated variable • The experiment is designed around this variable • It is graphed on the x-axis • There is generally one but at times there may be more than one dependent variable • It is the factor that you are watching for • It is sometimes called the responding variable • It is graphed on the y-axis Dependent variables
Example of variables • Bob wonders how temperature affects the amount of salt that dissolves in water. From prior research, he believes that hot water will dissolve more salt. • Independent variable-temperature change • Dependent variable-amount of salt dissolved • Control variable-initial amount of salt, amount of water, size of beakers muppet.wikia.com
Groups • Control group is the group with the standard set-up, which is used for comparison • Experimental group is the group that has the standard set-up except the variable being tested is changed
Groups cont. • Bob wonders how temperature affects the amount of salt that dissolves in water. From prior research, he believes that hot water will dissolve more salt. • Control group-water at room temperature • Experimental groups-water at 40°C, 60°C, 80°C http://biologycorner.com/worksheets/controls.html http://sciencespot.net/Media/scimethodconvar.pdf 60°C 40°C 80°C www.clker.com
Hypothesis • Testable solution to the question/problem • Can be written as an if…then statement which involves using the independent and dependent variables in the statement
Hypothesis example • Bob wonders how temperature affects the amount of salt that dissolves in water. From prior research, he believes that hot water will dissolve more salt. • If the temperature of the water is 80°C, then it will dissolve more salt than room temperature water. Or…. • The 80°C water will dissolve more salt than room temperature water.
Materials • Simply list the materials that would be used in the experiment • It should be written as a list • It doesn’t need to be numbered or bulleted • Bob’s experiment materials list Materials 4 beakers (same size) table salt water balance weighing dish spatula graduated cylinder thermometer pot hot plate
Procedure • Step-by-step process for experiment • It should be written brief and concise • It should be written with numbers instead of bullets or in paragraph form • Bob’s experiment example procedure Procedure • Pour 50ml of water into a beaker • Measure 20 g of salt and place it in the beaker • Wait 2 minutes. • Use the refractometer to measure the salinity of the water. • Record your results etc.
Data • Information that is obtained from performing the experiment • Data is your set of observations which can be quantitative or qualitative • Observations are things that you sense which can be something you see, hear, taste, feel, and smell • It is normally displayed in a table
Data cont. QuaNtitative • Information that is measurable and uses units • Ex. 10ml, 20°C,2m, 10s • Information that is more descriptive • Ex. red, smells like cinnamon, bitter, fizzes QuaLitative
Data • Sometimes it is necessary to graph your data. In this case, the independent variable is placed on the x-axis and the dependent variable is placed on the y-axis Y dependent x independent
Analysis • Taking a look at your data and interpreting for its importance and to see if there is a pattern from the data http://sciencespot.net/Media/scimthd_olympics.pdf
Conclusion • It explains the relationship between the variables (independent and dependent) • It also tells whether or not the hypothesis was supported
Validity of Experiment • To be sure that your experiment is valid several trials should be done. For our class, at least three trials should be done. • Trails means performing the experiment several times. • This ensures that your results are accurate