Download
1 / 48
480 likes | 511 Views
Learn advantages, disadvantages, variations, and analyses in repeated measures designs. Understand ANOVA, trends, contrasts, and error terms in various designs with practical examples. Master the methods and assumptions for precise interpretations.

E N D
ANOVA Designs Involving Repeated Measures 46-511: One-Way Repeated Measures and Groups by Trials
Learning Objectives • Be able to identify the advantages and disadvantages of repeated measures designs • Understand how variance is partitioned in RM designs • Comprehend variations possible with such designs • Be familiar with post-hoc & planned comparisons using RM Designs • Including Trend Analysis
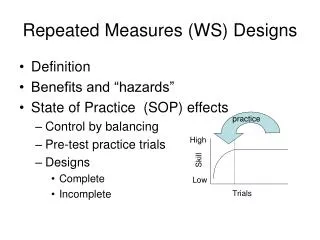
The Design • Repeated Measures Designs, a.k.a. • Dependent Measures Designs • Within-Subjects Designs • Mixed Randomized-Repeated Designs, a.k.a. • Groups by Trials • Split Plot Factorial • What are they • Relative Advantages • Relative Disadvantages
Some Examples • Completely Within Designs • 1-Way • N-Way • Mixed Randomized-Repeated Designs • 1-Between by 1-Within • N-Between by N-Within • Characteristics of repeated measures designs • Nature of the repeated measures • Duration between measures
1-Way Repeated Measures ANOVA: Sources of Variation • Between Subjects • Between Treatments • Within Subjects • Within Treatments
One-Way Example Five subjects, all are tested for reaction time after taking each of the four drugs, over a period of four days.
One-Way Example . . . Between Treatments Between Subjects Effects Within Subjects Where does Within Treatment variation come from?
Two Structural Models The rosy additive model: Xij = μ + πi + τj + εij The model that assumes people x treatment interaction: Xij = μ + πi + τj + πτij + εij
Partitioning Sums of Squares:or, here we go again Between People Between Treatments
Sums of Squares Within Within People Within Treatments
The error term • Two ways to get it: • SSRES = SSW.PEOPLE – SSTREAT • SSRES = SSW.TREATMENT – SSB.PEOPLE • How the error term differs from Between Subjects Design • What the error term represents/contains
Missing Data in Within Subjects Designs • Due to such things as • Equipment failure • Experimenter or subject error • Loss of questionnaires • Usual missing data solutions ignore design • Y*ij = predicted (missing) score • s = number of subjects • S’i = sum of known values for the case • a = number of levels of A • A’j = sum of known values of A • T’ = sum of all known values
Example • Say subject #3 didn’t return to take drug 4 • #3’s sum is now 62 • Sum for A4 is 130 (160-30) • Sum of known scores for entire table = 498-30=468 Error term must be reduced by number of imputed values (imputed values are not independent)
Assumptions • Observations within each treatment cell are independent. • Population treatment within each treatment must be normally distributed. • Variances for the population treatments should be equivalent. • Sphericity – that the variance of the difference scores for each pair of conditions is the same in the population. • Alternatives if assumptions do not hold.
Mean Comparison Procedures • Tukey • Same as in 1-way between, substitute MS error (residual) for MS within & df error for df within • Scheffe’ • Same as in 1-way between, substitute MS error for MS within & df error for df within • Bonferroni procedure • Šidák procedure
Contrasts • Unfortunately, contrasts are not quite a logical extension of contrasts from between subjects designs • Affected by mild violations of sphericity • Must determine variability specific to each contrast. • Two methods, t and F. • Let’s test the following contrast: • C1: .5*Drug1+.5*Drug2 – Drug3=0.
Method One Single Sample t-test: where and
Calculations for t: df = n-1; t(.05,4) = 2.78
Method 2: Using the F statistic Sum of squares for contrast: Sum of squares for error term:
Method 2 (Cont’d) df = 1, (n – 1) Recalling that t2 = F; 4.5352 = 20.566
Effect sizes Partial ω2: Partial η2 / R2: Cohen’s d: similar, have to decide on proper standard deviation
Power Use partial effect size Use G*Power or power charts. Assume ρ=.50 unless you know different.
Trend Analysis Example Experiment on forgetting: six participants master a list of 50 words, then are asked to recall them the next day (time 1), one week later (time 2), and so on.
Groups by Trials Design:What it is? • Combines between and within designs • Yields effects for… • Trials • Groups • Trials by Groups interaction • Can be used to answer questions such as… • Do test pattern scores (e.g., pre-post) differ by experimental vs. control group… • Do women and men differ significantly in their ability to detect smell in varying conditions. • Do patients receiving drug A have a different course of improvement than those receiving drug B?
Assumptions • The usual assumptions for between subjects designs • The usual assumptions for repeated measures designs • Homogeneity of variance/covariance matrices by group
Partitioning Variance! • Between Groups Variance – • Subjects within Groups Variance – • Between Trials Variance – • Group by Trials Variance – • Subjects within Groups within Trials Variance (residual) –
Between Group Variance Definitional Formula Computational Formula
Subjects within Groups Definitional Formula Computational Formula
Between Trials Variance Definitional Formula Computational Formula
Group by Trials Variance Definitional Formula Computational Formula
Subjects within Groups within Trials (residual) Definitional Formula Computational Formula
Two-Within Subject Factors • Brief Example • Effects • Main effects for Factor A • Main effects for Factor B • Interaction effect for A x B
Numerical Example Number of Books Read each Month by Genre A 3(month) x 2(genre) way within subjects ANOVA, where n=5
Two-way Repeated Measures ANOVA: Main effects Main effect for A
Why different error terms? • Recall SSRES=SSW.PEOPLE-SSTREAT SSRES=7-2.867=4.133
For B Main effect… SSRES=33.667-0.133=33.534
Finally, for AxB… SSRES=SSW.PEOPLE – SSA – SSB – SSAB – SSAS – SSBS SSRES=115.0 – 2.867 – 0.133 – 64.467 – 4.133 – 33.533 = 9.867