Download
1 / 19
200 likes | 310 Views
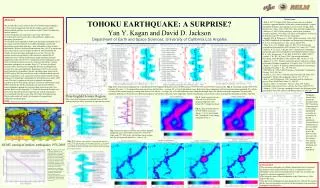
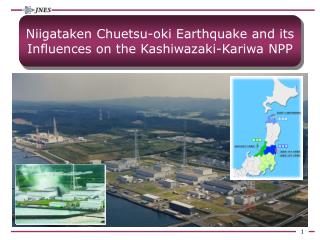
AGU annual fall meeting 2011 U41D-07. Shaking and Flooding by the Tohoku-Oki earthquake. Shengji Wei*, Rob Graves**, Don Helmberger *, Jean-Philippe Avouac * and Junle Jiang* * Seismological Lab, Division of Geological and Planetary Science, Caltech

E N D
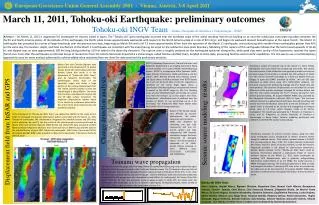
AGU annual fall meeting 2011 U41D-07 Shaking and Flooding by the Tohoku-Oki earthquake Shengji Wei*, Rob Graves**, Don Helmberger*, Jean-Philippe Avouac* and Junle Jiang* * Seismological Lab, Division of Geological and Planetary Science, Caltech ** United States Geological Survey
An unexpected earthquake! Earthquake in the last 100 yrs (M>7.5) 6 meter wall for fukushima N-plant http://www.snptc.com.cn/Lists/xwzx/Attachments/712/%C8%D5%B1%BE.jpg fukushima Raw data Hashimoto, 2009, Nature Geoscience
Frequency Content in the Data MYGH12: strong motion 0550: High-rate GPS acceleration Impossible velocity Hard displacement Easy
Outline • 1. Use strong motion and geodetic data constrain • the kinematic rupture process of the earthquake • 2. Prediction: • 2.1 Tsunami • 2.2 High-rate GPS • 3. 3D strong motion simulation • 3.1 Refinements to source to enhance shorter • period energy radiation • 3.2 Use 3D crustal model to improve fits to • observed motions • 4. Conclusion
Finite Fault Inversion Method We need a layered crustal model to calculate synthetic seismogram: A simulated annealing algorithm is used to simultaneously invert for the: slip amplitude, slip direction, rise time, rupture velocity Jiet. al., 2002a, BSSA Ji et. al., 2002b, BSSA Chi-Chi Earthquake
Data resolution Data used: 14 Strong motion stations Over 1000 GPS stations (static) 5 ocean bottom GPS station 5 Ocean bottom GPS data from: Sato et. al., 2011, Science
Tsunami waveforms prediction: • COMCOT simulation with nonlinear shallow-water equation w/o dispersion • instantaneous seafloor deformation
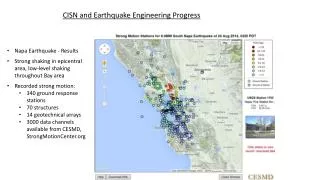
Shaking produce by the earthquake MYGH12 Strong motion High-rate GPS In velocity In displacement
Summary of all High-rate GPS fits Cross-correlation between High-rate GPS and synthetics (>5s)
Japan 3D Crustal Seismic Velocity Model (NIED): • http://www.j-shis.bosai.go.jp/map/?lang=en • Mid to upper crust only (< 20 km) • Horizontal resolution about 1 km • 34 isovelocity layers (Vs: 0.35 – 3.4 km/s) • Onshore and offshore regions • Superpose on background 1D crust and upper mantle structure
Refine source model to enhance shorter period energy • (following Graves and Pitarka, 2010, BSSA) • Retain longer wavelength slip features (> 40 km) • Retain original rupture initiation times • Add stochastic slip features at shorter length scales (K-2 falloff) • Replace symmetric slip-rate function with “Kostrov-like” representation including slip and depth dependence of rise-time
Effect of source refinement on shorter period energy radiation • Similar radiation on shallow fault • Enhanced radiation on deeper fault
PGV prediction with refined source and 3D velocity model 4s and longer original
Original source model • 1D seismic velocity model • Refined (rough) source model • 3D seismic velocity model
Conclusion • 1, Shaking came from the deeper (>30km) portion of the rupture. • 2, The large tsunami originated from very large slip at shallow depth. • 3, Using refined source model with 3D crustal model provides improved fit to observed motions.