Download

1 / 21
210 likes | 446 Views
A Step-Down Lenth Method for Analyzing Unreplicated Factorial Designs. Kenny Q. Ye, Michael Hamada, C. F. J. Wu Journal of Quality Technology, Apr 2001, Vol. 33, pg. 140, 13 pgs 報告者:陳怡綾. Outline. 1. Introduction 2. A Step-Down Lenth Method 3. An example

E N D
A Step-Down Lenth Method for Analyzing Unreplicated Factorial Designs Kenny Q. Ye,Michael Hamada,C. F. J. Wu Journal of Quality Technology, Apr 2001, Vol.33,pg.140,13pgs 報告者:陳怡綾
Outline • 1. Introduction • 2. A Step-Down Lenth Method • 3. An example • 4. A Synthetic Example • 5. A Simulation Study • 6. Conclusions
1.Introduction • A commonly used method to identify active effects from such experiments is the half-normal plot. • To overcome the subjectivity of using the half-normal, many formal testing methods have been proposed. In this paper, we propose a step-down version of the Lenth method called “step-down Lenth method”. • It is compared via simulation with the original Lenth method and with stepwise methods proposed by Venter and Steel (1998). It is shown that the step-down Lenth method is better than the original Lenth method and Venter and Steel step-down method. • IER: the proportion of inactive individual effects declared active EER(experimentwise error rate): the error rate of at least one inactive effect being declared active.
2. A Step-Down Lenth Method Lenth Method P254
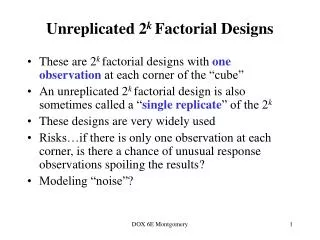
3.A Example P246 Montgomery(1991) presents a unreplicated experiment using a design to study the filtration rate of a pressure vessel. The four factors are temperature (A), pressure (B), concentration of formaldehyde , (C) ,and the stirring rate (D)
In this example, the original Lenth statistics and step-down Lenth statistics happened to be the same for all the effects calculated, because the PSE remained the same in each step.
Since there is no large difference between the absolute contrasts,using the half-normal plot might not detect any effects.
This example shows that when the magnitudes of the active effects vary from small to large, both the Lenth method and half-normal plots may fail to detect them.
5.A Simulation Study • We performed a simulation study to compare four methods, which are the step-down Lenth method, the original Lenth method,the fix RMS scaling step-down method, and the sequential RME scaling step-up method. The last two methods were proposed and studied by Venter and Steel(1998). • The test statistics used by Venter and Steel are similar to our step-down Lenth statistics, expect that the root mean square(RMS) replaces PSE. • The fix RMS scaling step-down method uses the same set of small absolute contrasts to calculate the RMS at each step.The the sequential RME scaling step-up method uses a different set of contrasts to calculate the RMS at each step.
Our the simulation study considers the case of 15 contrasts under the following six configurations:
6.Conclusions • In this paper, we propose a step-down version of the Lenth method for identifying active effects in unreplicated experiments. It controls the EER closer to the nominal significance level than the original Lenth method does. • In particular, when there are a moderate number of active effects whose values range from small to large, the original Lenth method and half-normal plot tend to miss them. • The performances of the RMS stepwise methods and step-down Lenth method are comparable in most cases.