Download
1 / 29
290 likes | 436 Views
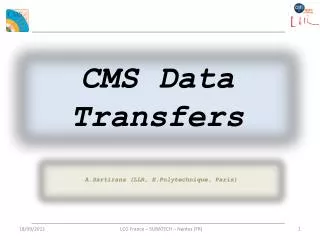
WAN area transfers and networking: a predictive model for CMS. WLCG Workshop, July 7-9, 2010 Marie-Christine Sawley, ETH Zurich. CMS Data Flow in the Computing Grid. Prompt Reconstruction. TIER-0. CASTOR. CAF. Calibration Express-Stream Analysis. 600MB/s. 50-500MB / s. TIER-1.

E N D
WAN area transfers and networking: a predictive model for CMS WLCG Workshop, July 7-9, 2010 Marie-Christine Sawley, ETH Zurich
CMS Data Flow in the Computing Grid Prompt Reconstruction TIER-0 CASTOR CAF CalibrationExpress-Stream Analysis 600MB/s 50-500MB/s TIER-1 Re-Reconstruction Skims TIER-1 TIER-1 50-500MB/s ~20MB/s TIER-2 TIER-2 TIER-2 TIER-2 Simulation Analysis
Purpose of the predictive model • Need to • Re-examine the computing model according to conditions, and adapt whenever needed • Keep track of the deployment of the resources at different Tiers • Develop a tool which would yield reliable information for the ramping up for the years to come • Tool has no value without dialog nor comparison with the measured rates
Exporting custodial data: methodology • T0—> T1s : exporting FEVT • BW=(RAW+RECO) x Trigger frequency x (1+overlap factor). For the chosen parameters, this yields: BW= 2 MB x 300Hz x 1.4 = 840 MB/sec, or 6.75 Gb/sec. • Each T1 receives a share according to its relative size in CPUs • Proportional to the trigger rate, event size and Tier-1 relative size • In 2010 we will continue to send more than 1 copy of the data, but the event size is smaller
CERN to Tier-1 in 2010 • Rate is defined by the accelerator, the detector and the data distribution policy • Livetime of the machine is lower than we expect for the future • System is specified to recover between fills • Data is over subscribed • Will continue as resources allow • RAW event size is smaller than our estimates • Event rate is defined by the physics program • We expect the average rate from CERN to Tier-1s will increase, but we would like to track the changes so that planning matches measured rates • Dimension according to expected bursts or peaks
Tier-0 to Tier-1 • CERN to Tier-1 Average since beginning of 2010 run 600MB/s
Tier-1 to Tier-1 in 2010 • The CMS plan currently is ~ 3.5 copies of the AOD • After an refresh of the full sample of a year’s running this is 1.6PB of disk to update • Using 10Gb/s that takes 20 days. • Achieving 30Gb/s is a week • The Computing TDR had 2 weeks • In 2010 we will also be replicating large samples of RECO • Recovering from a data loss event at a Tier-1 is more challenging because the data might be coming from 1 place only • Could also take longer with the normal risk of double failure
Tier-1 to Tier-1 • Transfers are used to replicate raw, reco and AOD data, recover from losses and failures at Tier-1 sites
Tier-1 to Tier-2 • Data from Tier-1 to Tier-2 is driven by event selection efficiency, frequency of reprocessing, level of activity • All of these are harder to predict, but translate into physics potential • The connections between data production sites and analysis tiers needs to allow prompt replication • CMS is currently replicating 35TB of data that took 36 hours to produce to 3 sites (~100TB) • These bursts are not atypical
Tier-1 to Tier-2 • CMS is very close to completing commissioning the full mesh of Tier-1 to Tier-2 transfers at a low rate • Working on demonstrating more links at 100MB/s • Daily average exceeding 1GB/s June 11/Ian Fisk
Generic Tier1 Tape system N% Users 2. Data taking: total sample 3. During re-reprocessing 6. Daily export for data analysis: -from affliliated T2s for the whole AOD sample (re-RECO) -from all Tiers 2 for custodial AOD Number kSP06 • Custodial • Data • (prop. to the relative size) TO 5. MC PROD 4. AOD Sync 4. AOD Sync Exports Imports Tier1s Affiliated Tier2s
The results • 1 slide per regional Tier1 • Pledged Cores are for 2010 • Remember: this are really raw values • Links: • Solid line: sustained bandwidth (data taking and re-processing periods ONLY) • Broken line: peak bandwidth (may happen at any time: numbers shown is the total if it all happens at the same time ) • For each Tier 1, the fraction of served users for analysis is a combination based on • Relative size T2s for analyzing the share of 1srt AOD at considered Tier1, number of users based on the number of supported physics groups • Relative size of T1 for analyzing the full AOD
FRANCE IN2P3 Tape system 13% Users 2. Data taking: (total sample 300TB) 45 MB/sec 3. During re-reprocessing 1. Data taking 50 MB/sec 6. Daily export for data analysis: 70 TB 20 MB/sec 7 Gb/s 0.40 Gb/s IN2P33 9.06 kSP06 TO 0.20 Gb/s 5. MC PROD: 700TB 4. AOD Sync 2.5 Gb/s 4. AOD Sync Exports 370 TB Imports 520TB 3.5 Gb/s Tier1s 6 Tier2s
GERMANY FZK Tape system 8% Users 2. Data taking: (total sample 280TB) 40 MB/sec 3. During re-reprocessing 1. Data taking 40 MB/sec 6. Daily export for data analysis: 36 TB 20 MB/sec 3.5 Gb/s 0.3 Gb/s FZK 10.05 kSP06 TO 0.15 Gb/s 5. MC PROD: 580 TB 2.3 Gb/s 4. AOD Sync 4. AOD Sync Exports 367 TB Imports 522 TB 3.6 Gb/s Tier1s 3 Tier2s
ITALY CNAF Tape system 10 % Users 2. Data taking: (total sample 345TB) 50 MB/sec 3. During re-reprocessing 1. Data taking 50 MB/sec 5. Daily export for data analysis: 40 TB 20 MB/sec 3.6 Gb/s 0.4 Gb/s CNAF 12. 5 kSP06 TO 0.12 Gb/s 5. MC PROD: 440TB 2.8 Gb/s 4. AOD Sync 4. AOD Sync Exports 415 TB Imports 514 TB 3.5 Gb/s Tier1s 4 Tier2s
SPAIN PIC Tape system 8 % Users 2. Data taking: (total sample 151TB) 20 MB/sec 3. During re-reprocessing 1. Data taking 20 MB/sec 5. Daily export for data analysis: 32 TB 10 MB/sec 3.0 Gb/s 0.2 Gb/s PIC 5.46 kSP06 TO 0.08 Gb/s 5. MC PROD: 420 TB 1.2 Gb/s 4. AOD Sync 4. AOD Sync Exports 181 TB Imports 553 TB 3.7 Gb/s Tier1s 3 Tier2s
TAIWAN ASGC Tape system 5 % Users 2. Data taking: (total sample 400 TB) 50 MB/sec 3. During re-reprocessing 1. Data taking 50 MB/sec 6. Daily export for data analysis: 5 TB 25 MB/sec 0.4 Gb/s 0.4 Gb/s TAIWAN 14 kSP06 TO 0.08 Gb/s 5. MC PROD: 250 TB 3.10 Gb/s 4. AOD Sync 4. AOD Sync Exports 464 TB Imports 506 TB 3.40 Gb/s Tier1s 3 Tier2s
UK RAL Tape system 15% Users 2. Data taking: (total sample 225TB) 30 MB/sec 3. During re-reprocessing 1. Data taking 30 MB/sec 6. Daily export for data analysis: 39 TB 20 MB/sec 3.7 Gb/s 0.25 Gb/s RAL 8.04 kSP06 TO 0.2 Gb/s 5. MC PROD: 700 TB 1.8 Gb/s 4. AOD Sync 4. AOD Sync Exports 267 TB Imports 530 TB 3.6 Gb/s Tier1s 4 Tier2s
USA FNAL Tape system 24 % Users 2. Data taking: (total sample 1230 TB) 165 MB/sec 3. During re-reprocessing 1. Data taking 160 MB/sec 6. Daily export for data analysis: 120 TB 80 MB/sec 11 Gb/s 1.30 Gb/s FNAL 44.4 kSP06 TO 0.34 Gb/s 5. MC PROD: 1274 TB 10 Gb/s 4. AOD Sync 4. AOD Sync Exports 1.5 PB Imports 340 TB 2.3 Gb/s Tier1s 9 Tier2s
Data rate intake by Tier2 estimate • Data import simulated taking the parameters of the 2010-11 run • The association with Physics groups is taken into consideration • The global processing capacity of Tier1s and the relative disk space of each Tier2 are taken into consideration • Expected rate if all PG work at the same time, on a single day • Sustained rate on a peak day (any better definition?) • Purpose • Inform sites about usage/load, planning • Helping sites which may run into imbalance, such as • WAN likely to be a limitation, especially if site is serving >1 VO • Imbalance between number of PG and the amount of local resources
Data rate intake by Tier-2Preliminary comparison with measured rate • Data from Data Ops • T1 to T2, best rate from sample of measures over a few hours, between November and March (200 files -2GB each- sent between T1 and T2) • For 27 sites, the simulation gives a number below the measured data rate satisfactory • For 9 sites, there are no valuable data yet to be compared • For 7 sites, 1 (or more) link is above simulated data rate, however the average is below monitor and try to understand • For 4 sites, all measured links were below simulated data rate go deeper
Possible reasons forsignificant deviation between results • Simulation may be inaccurate for that particular site • Model keeps being refined • New measurements keep coming • Real limitations may come from • WAN • A few parameters to tune at the Tier-2 • ….. • Still very much Work in Progress, do not jump on conclusions before further analysis
Outlook • Development of the model is on going • Taking regularly into account real activities • CERN to Tier-1s is driven by the detector and the accelerator • Tier-1 to Tier-1 is driven by need to replicate samples and to recover from problems. See reasonable bursts that will grow with the datasets. • Tier-1 to Tier-2 is driven by activity and physics choices • Large bursts already. Scale as activity level and integrated lumi • Tier-2 to Tier-2 is ramping up. • Keeping the dialog with the sites and the specialists to enrich the model
Thank you Acknowledgements Ian Fisk, Daniele Bonacorsi, JosepFlix, Markus Klute, OliGutsche, Matthias Kasemann Question or feedback? sawley@cern.ch