Download

1 / 96
960 likes | 1.12k Views
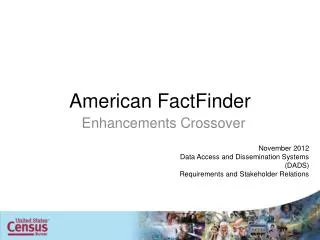
American Factfinder for Native American Profiles. Epidemiology 552 September 2009. Ten States With the Largest American Indian Populations: 2000. AK 119,241. WA 158,940. NY 171,581. MI 124,412. CA 627,562. NC 131,736. OK 391,949. AZ 292,552. NM 191,495. TX 215,599.

E N D
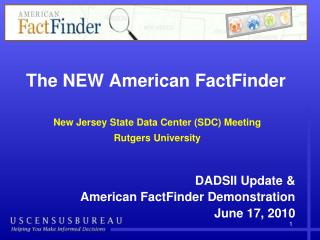
American Factfinder for Native American Profiles Epidemiology 552 September 2009
Ten States With the Largest American Indian Populations: 2000 AK 119,241 WA 158,940 NY 171,581 MI 124,412 CA 627,562 NC 131,736 OK 391,949 AZ 292,552 NM 191,495 TX 215,599
States With the Largest Percentage of American Indians: 2000 AK 15.6% SD 8.3% NM9.5%
Outline of Presentation • Examples of Census Data • Census Questionnaire • Census Geography • Creating a Profile of Native American area • Updating the 2000 Census
Class Materials • Census Guide http://www-personal.umich.edu/~graceyor/doctemp/epidem.html • Powerpoint Presentation http://www-personal.umich.edu/~graceyor/doctemp/epidem09.ppt
Characteristics of Navajo Reservation Compared to the Nation Navajo National Median Age 24 35.6 People in Families 94% 83% High School Graduates 56% 80% Unemployment – Male 28% 6% Unemployment – Female 21% 6% Median Household Inc $20,005 $41,994 Poverty Rate 43% 12% Homes w/o Full Plumbing 45% 1%
Characteristics of Navajo Reservation Compared to Tohono Navajo Tohono Median Age 24 26.2 People in Families 94% 93% High School Graduates 56% 62.1% Unemployment – Male 28% 31% Unemployment – Female 21% 16% Median Household Inc $20,005 $19,970 Poverty Rate 43% 46.4% Homes w/o Full Plumbing 45% 18.4%
Two Questionnaires 100% Questionnaire Sent to all households SAMPLE Questionnaire Sent to one-sixth of households
2000 Questionnaire 100% Questionnaire • Age • Sex • Race (Multiple) • Hispanic origin • Household relationship • Occupied v. vacant housing units • Owner v. renter occupied housing
Race Groups in 2000 • White • Black or African-American • American Indian or Alaskan Native • Asian • Hawaiian or Pacific Islander • Other • Two or More Races
Native Americans(AIAN) • All files have overall American Indian table breakdowns • Several files have breakdowns by 39 major tribal groups (e.g. Chippewa, Cherokee, Navajo) • One file has breakdown by 1081 tribes, including Bay Mills Chippewa
Hispanic Not considered a race Can be Hispanic and any race Breakdowns in some tables • Cuban • Puerto Rican • Mexican • Spanish • Various Latin American Countries
Calculating Minorities White, non-Hispanic found in Hispanic tables Subtract White, Non-Hispanic from total population to get total minority population Total Michigan 9,938444 White Non-Hispanic -7,806,691 Minority = 2,131,753
Household Relationships Relationship to Householder • Spouse • Child • Stepchild • Grandchild • Brother/Sister • Parent • Non-relative • Unmarried partner is separate category
100% Questionnaire Data Reports Pre-Tabulated Data • Summary File 1 – most age, race, sex data to the smallest geographies, block and block group • Summary File 2 – same data by 250 races (including 39 tribes) to neighborhood (tract) level
2000 Sample Questionnaire • Marital status, housing value and rent • Grandparents as caregivers (new) • Ancestry • Language • Country of origin • School enrollment and educational attainment (and dropouts)
2000 Sample Questionnaire • Employment • Industry and occupation • Transportation to and place of work • Disability and mental illness • Veteran status • Income and poverty
Sample Data Products Pre-Tabulated Data • Summary File 3 – socio-economic and housing characteristics to census tract or block group level; 7 races including American Indian total • Summary File 4– same data as Summary File 3 for 210 racial and 125 ethnic groups to tract level, including 39 tribes • Native American File – same data as Summary File 3 for 1081 tribes to metropolitan area or Indian reservation
Questionnaires for Epidemiology 552 • Use 100% data for age and race. Summary File 2. • Use sample data for • ancestry, language, occupation, education, • industry, income, poverty, and mental disability. Summary File 4.
Census Geography Legal Areas • Nation • State • Native American Areas • Counties • Cities • Townships • Congressional Districts • School Districts
Census Geography Census-Designated Areas • Metropolitan Statistical Area • Urbanized Area • Census Tract • Block Group • Block • Zip Code Tabulation Area
Metropolitan Statistical Area • Central city of 50,000 or more • Its own county, and • Surrounding counties with • heavy commuting patterns
Detroit Consolidated Metropolitan Statistical Area 1990 Lapeer Livingston Detroit PMSAMacomb Monroe Oakland St. Clair Wayne Ann Arbor PMSAWashtenaw 2000 Lapeer Macomb Detroit PMSAMonroe Oakland St. Clair Wayne Lenawee Ann Arbor PMSALivingston Washtenaw Flint PMSAGenesee
Census Tracts • Areas of about 4000 people • Approximate neighborhoods
American Factfinder http://factfinder.census.gov/ • Prepared profiles • Data extraction to a spreadsheet • Reference and thematic maps • Do not use Internet Explorer on • campus (downloading problems)
Data Files http://factfinder.census.gov/
Data File Options http://factfinder.census.gov/
Data File Options http://factfinder.census.gov/
Select Geography http://factfinder.census.gov/
Select Table http://factfinder.census.gov/
Select Population Groups http://factfinder.census.gov/
Search Result - Download http://factfinder.census.gov/
Downloading http://factfinder.census.gov/
Downloading http://factfinder.census.gov/
Downloading http://factfinder.census.gov/
Single Years of Age by RaceDetailed Tables http://factfinder.census.gov/ • For Navajos over 100 for U.S. and Navajo Reservation, choose SF2, Detailed Tables
Single Years of Age by RaceDetailed Tables http://factfinder.census.gov/ 2. Choose Geography, United States, Highlight and ADD, Then choose AI Areas, Navajo, and ADD.
Single Years of Age by Race Detailed Tables http://factfinder.census.gov/ . 3. Choose Table. If you’re unsure of a table, highlight it and click What’s This for a sample.
Single Years of Age by RaceDetailed Tables http://factfinder.census.gov/ 4. Highlight table, ADD, and click on NEXT.
Single Years of Age by RaceDetailed Tables http://factfinder.census.gov/ 5. Choose Population Group. Total is automatic. You can highlight Navajo and ADD.
Single Years of Age by RaceDetailed Tables http://factfinder.census.gov/ Table has single years through 100 for both sexes and two population groups.
Navigating FactfinderDetailed Tables http://factfinder.census.gov/ You can change geography, table, or population using breadcrumbs
Navigating FactfinderDetailed Tables http://factfinder.census.gov/ Click on Tables in the top breadcrumb. Choose new table and remove the old.
Navigating FactfinderDetailed Tables http://factfinder.census.gov/ You will need to re-choose your population group.
Navigating FactfinderDetailed Tables http://factfinder.census.gov/ Family types in the U.S. and the Navajo Reservation
Single Years of Age by RaceCustom Tables http://factfinder.census.gov/ Custom tables allows you to choose individual values in one or more tables. Skip Examples
Single Years of Age by RaceCustom Tables http://factfinder.census.gov/ 1. Select Geography – same as before