1 / 1

PDGF A

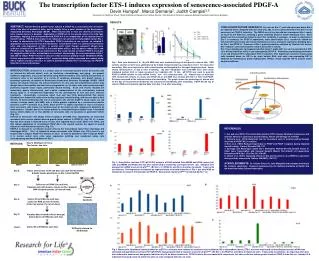
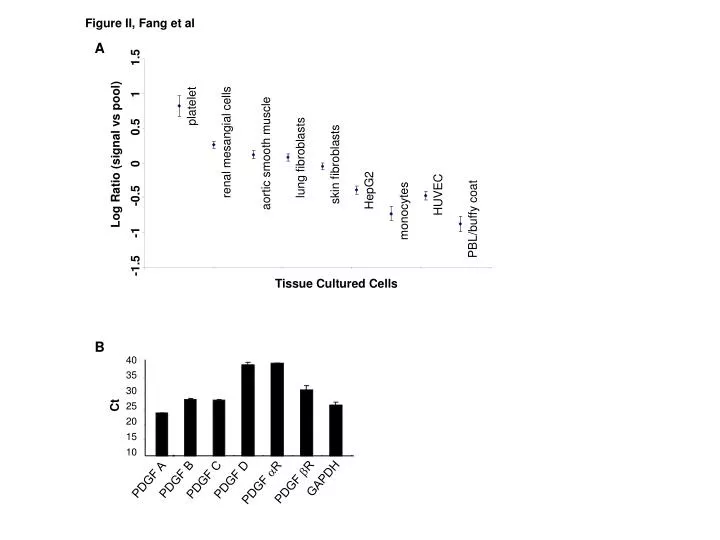
B. 40. 35. 30. Ct. 25. 20. 15. 10. GAPDH. PDGF A. PDGF B. PDGF C. PDGF D. PDGF b R. PDGF a R. Figure II, Fang et al. A. 1.5. 1. platelet. 0.5. renal mesangial cells. aortic smooth muscle. Log Ratio (signal vs pool). lung fibroblasts. 0. skin fibroblasts. HepG2. HUVEC.

zelda
Download Presentation

PDGF A

An Image/Link below is provided (as is) to download presentation Download Policy: Content on the Website is provided to you AS IS for your information and personal use and may not be sold / licensed / shared on other websites without getting consent from its author. Content is provided to you AS IS for your information and personal use only. Download presentation by click this link. While downloading, if for some reason you are not able to download a presentation, the publisher may have deleted the file from their server. During download, if you can't get a presentation, the file might be deleted by the publisher.

E N D

Presentation Transcript


  1. B 40 35 30 Ct 25 20 15 10 GAPDH PDGF A PDGF B PDGF C PDGF D PDGF bR PDGF aR Figure II, Fang et al A 1.5 1 platelet 0.5 renal mesangial cells aortic smooth muscle Log Ratio (signal vs pool) lung fibroblasts 0 skin fibroblasts HepG2 HUVEC -0.5 monocytes PBL/buffy coat -1 -1.5 Tissue Cultured Cells

More Related