Download
1 / 14
140 likes | 266 Views
3-6 Graphing Inequalities. Objective. Learn to graph linear and absolute value inequalities on the coordinate plane. Vocabulary. Related equation The equation that the inequality resembles Ex. y > 3x + 5 and y = 3x + 5 Boundary

E N D
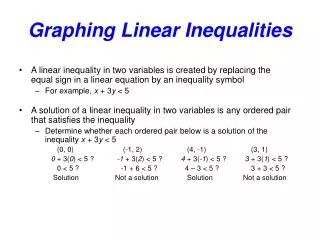
Objective Learn to graph linear and absolute value inequalities on the coordinate plane
Vocabulary • Related equation • The equation that the inequality resembles • Ex. y > 3x + 5 and y = 3x + 5 • Boundary • A line or curve that separates the coordinate plane into two regions
Determine if boundary is dashed/solid (< or > ----->, ≤ or ≥ →) Plug in any pt not on boundary (0, 0) is simplest if available Find related equation ex)y < 5x + 6, y = 5x + 6 Graph the boundary DO NOT SHADE THIS REGION!! SHADE OTHER REGION! Shade the region where the test point resides Graphing Inequalities Sets Boundary FALSE TRUE
Graph Example 7-1a Ex 1
Graph Example 7-1c Ex 2
Graph Example 7-3a Ex 3
Example 7-3b Ex 4
Ex 5 Example 7-2a Education The SAT has two parts. One tutoring company advertises that it specializes in helping students who have a combined score on the SAT that is 900 or less. Write an inequality to describe the combined scores of students who are prospective tutoring clients. Does a student with a verbal score of 480 and a math score of 410 fit the tutoring company’s guidelines?
Example 7-2g Ex 6 Class Trip Two social studies classes are going on a field trip. The teachers have asked for parent volunteers to also go on the trip as chaperones. However, there is only enough seating for 60 people on the bus. a.Write an inequality to describe the number of students and chaperones that can ride on the bus. • Graph the inequality. • c. Can 45 students and 10 chaperones go on the trip?
Homework • Text p. 98 (13-27 odd)