Download
1 / 6
70 likes | 253 Views
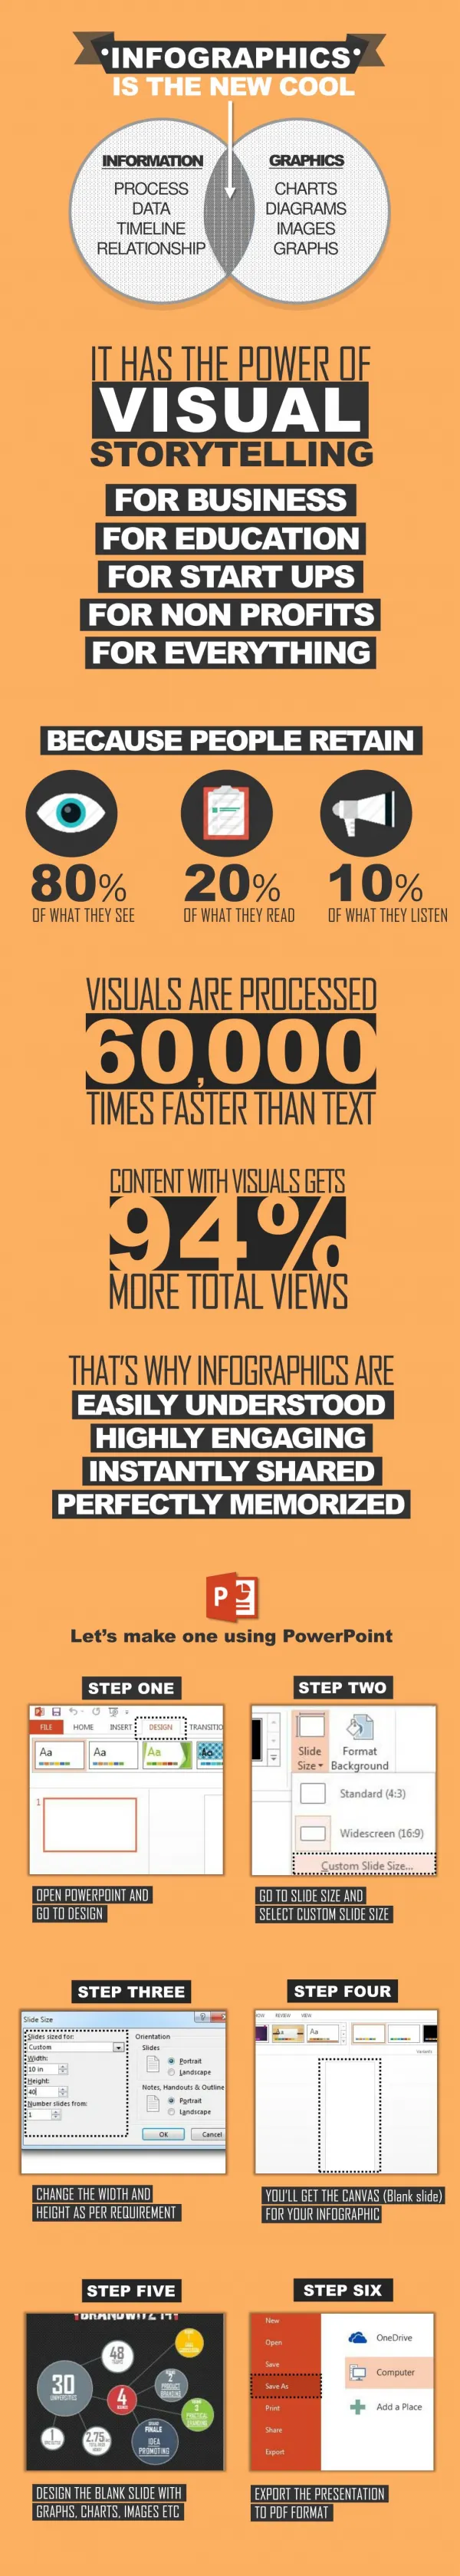
Using Easel.ly to Create Infographics. Learning Target : I can learn how to create an infographic using the program Easel.ly in order to visually represent an issue in an African country. Register for Easel.ly. Go to www.easel.ly Click Register on the upper right.

E N D
Using Easel.ly to Create Infographics Learning Target: I can learn how to create an infographic using the program Easel.ly in order to visually represent an issue in an African country.
Register for Easel.ly • Go to www.easel.ly • Click Register on the upper right. • Create a username. Recommendation: Use your Eckstein username or one you already know. • Enter your email. *NOTE: If you do not have an email, talk to Mr. Lane or Ms. Sterling.* • Create a password. Recommendation: Use your Eckstein password or one you already know. • Enter your first and last name.
Decide on Your Design • “Vhemes” are visual themes. Look at where it says “public visuals,” and pick one of the vhemesby clicking on it. You can either start fresh with a blank one or adapt one that is already there. • Save your Vhemein the upper left-hand corner as your FIRST NAME, LAST INITIAL, ISSUE. Example: Erin S. Child Trafficking in Ghana • Look at the top heading bar. • Objects have a number of different categories: People (default), Animals, Banners, Food, Icons, Landmarks, Maps, Music, Nature, Transportation • Background changes the orientation (landscape/portrait) and color. • Shapes are common shapes you might use. • Text adds a text box. Choose either Title, Header, or Body. • Upload allows you to upload an image of your choice. NOTE: If you are uploading an image from a website, you need to give credit for that website. The website should go in your Sources list. Ask Ms. Sterling or Mr. Lane if you have any questions on how to give credit for images.
Meeting Standard • To meet standard, you need: • 1 claim about an issue in an African country • 1 graphic or symbol that represents your claim • 3 supporting pieces of evidence • 3 graphics or symbols that connect to each piece of evidence (NOTE: 4+ to exceed standard) • List of sources used
Tips and Tricks for Using Easel.ly • To delete an object, you need to click on the object and press the trash can icon on the top. NOTE: You *cannot* press the delete key or right-click to delete. • To edit text, double-click on the text box. NOTE: The text will go all in one straight line, so you need to hit the Enter key on the keyboard whenever you want a new line. You can change the size, font, color, opacity (how faded it is), or make it bold/italicized/underlined/shadowed, but you cannotchange the justification (left, center, right) automatically. • SAVING REMINDER: Save your infographic every time you add an object.
Final Steps: Revise and Save Your Final Version • Analyze your infographic using your rubric to make sure you have included everything. • Do you have a claim with at least 3 pieces of supporting evidence? • Does your claim focus on a human rights issue in your African country? • Do you have a graphic/symbol for the claim and each piece of supporting evidence? • Are you following grammar/spelling rules? • Do you have your sources listed? • Is the information (graphics, claim, and details) displayed in a thoughtful, visual way? • Make any changes necessary. • After you save your infographic, go back to the Home page (on the upper left). • Click on your infographic that you just created. • Click “View/Share” underneath the infographic. • Click “Download.” • Save it to your student folder or a flash drive.