Download
1 / 27
340 likes | 860 Views
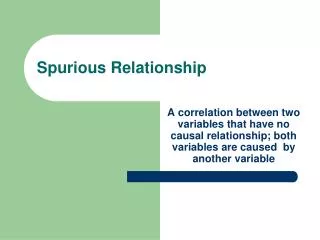
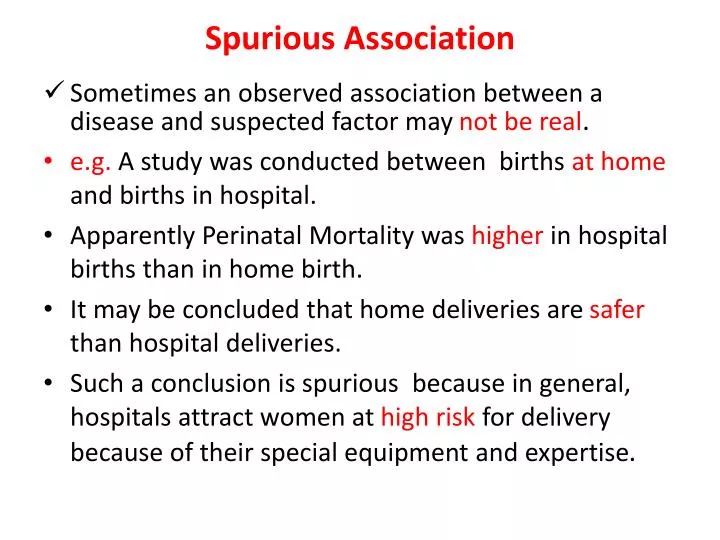
Spurious Association. Sometimes an observed association between a disease and suspected factor may not be real . e.g. A study was conducted between births at home and births in hospital. Apparently Perinatal Mortality was higher in hospital births than in home birth.

E N D
Spurious Association • Sometimes an observed association between a disease and suspected factor may not be real. • e.g. A study was conducted between births at home and births in hospital. • Apparently Perinatal Mortality was higher in hospital births than in home birth. • It may be concluded that home deliveries are safer than hospital deliveries. • Such a conclusion is spurious because in general, hospitals attract women at high risk for delivery because of their special equipment and expertise.
Multifactoral Causation • Multiple causes result in what is known as “web of causation”very common for non-communicable / chronic diseases. • In lung cancer more than one factor (e.g. air pollution, smoking, heredity) can produce the disease independently.
Causal Web Causal factors act in a hierarchal web Chapter 2
ACCESSPTB • A useful mnemonic to remember it. • Access Pakistani Text Books • Hill’s Criteria • Causal guidelines suggested by Austin B Hill • Hill even stated that he did not intend for these "viewpoints" to be used as “hard and fast rules.”
What is Bias? • An error in sampling or testing that systematically under- or over-represents one outcome (answer) over the other. • A distortion in the perception of the effects of a treatment or in the measurement of difference between the effects of two treatments. • Will tend to mask the true strength of association.
Types of Biases There are basically only three major types of biases. • Selection bias • Response bias • Information bias All others are simply varieties of these three types
Selection Bias • Caused by nonrandom sampling, so that a systematic difference is present between people selected for the study and people not selected for the study. • Can be caused by convenient sampling, patient referral patterns, survival differences or loss to follow-up. • This is an avoidable bias, and if not eliminated, can ruin the chances of acceptance or publication of the study.
Information (Measurement) Bias • a systematic difference between the measurements (or information) recorded in different study groups. • For example, in cohort studies, people with the risk factor may be tested more frequently and carefully than the control group. This is also called ‘surveillance’ bias or ‘diagnostic suspicion’ bias.
Interviewer Bias • An interviewer’s knowledge may influence the structure of questions and the manner of presentation, which may influence responses. • Interviewer’s IQ may also influence in understanding the responses. • Observers may have preconceived expectations of what they should find in an examination.
Recall Bias • a type of information bias, when people with a certain condition are more likely to remember exposure to the risk factor under study than the control group. It can occur easily in case-control or cross-sectional studies, but not in cohort studies.(those with a particular outcome or exposure may remember events more clearly or amplify their recollections) • For example parents of children with cancer may ‘remember’ more information about details of risk factors and their exposure to them, than parents of control children with identical exposure rates.
Attrition Bias (Loss to follow-up) • Attrition is a reduction in the number of patients who remain in the study (patient drop out). • This results in an attrition bias when the patients who drop-out of the study are systematically different from those who remain in and complete the study. • It can occur in clinical trials and in cohort studies.
Admission Rate (Berkson’s) Bias • a selection bias that occurs when the hospital admission rate of controls and cases are different. • It is likely to seriously affect odds ratio (OR) values in case-control studies, as controls are likely to be admitted less frequently than cases. • Patients with two or more overlapping conditions are more likely to be admitted. Researchers may mistakenly assume an association between two or more conditions.
Prevalence / Incidence (Neyman’s) Bias • It occurs when a disease is characterized by early fatalities (death before diagnosis) or silent cases (no evidence of exposure at time of disease onset). • It occurs whenever there is a ‘time gap’ between ‘exposure and subjects’ selection, so that the ‘worst’ cases have died out. • A cohort study begun before the disease will detect occurrences correctly. A case-control study begun later will only record the cases that have remained and did not die.
Confounding Bias • A confusion or mixing of effects. • A confounder is an extraneous variable that totally or partially accounts for the apparent effect of the study exposure on the outcome. It may even mask an underlying true association or reverse it. • The distortion can be large and leads to over-estimation or under-estimation of an effect, it can even change the apparent direction of an effect.
Confounder … must be • Risk factor among the unexposed (itself a determinant of disease) • Associated with the exposure under study. • Unequally distributed among the exposed and the unexposed groups.
Examples … confounding LUNG CANCER SMOKING (As age advances chances of lung cancer increase) AGE (If the average ages of the smoking and non-smoking groups are very different)
Examples … confounding HEART DISEASE COFFEE DRINKING (Smoking increases the risk of heart ds) (Coffee drinkers are more likely to smoke) SMOKING
Examples … confounding MYOCARDIAL INFARCTION ALCOHOL INTAKE (Men are more likely to consume alcohol than women) (Men are more at risk for MI) GENDER
Table 1. Relation of Myocardial infarction (MI)to Recent Oral Contraceptive (OC) Use
Table: Age -specific Relation of Myocardial infarction (MI) to recent Oral Contraceptive (OC) Use
Methods for controlling Selection Bias During Study Design • Randomization • Restriction • Matching During analysis • Stratification • Adjustment • Simple / standardization • Multiple / multivariate adjustment • Best case / worst case analysis
Randomization • Random assignment of patients to experimental group or a control group. • Helps to prevent selection bias / ‘confounding by indication’ by the clinician. • Any remaining differences between the groups are due to chance.
Restriction • Subjects chosen for study are restricted to only those possessing a narrow range of characteristics, to equalize important extraneous factors. • Limitation: Generalisability is compromised; by excluding potential subjects, cohorts / groups selected may be unusual and not representative of most patients or people with condition.
Example… Restriction • Study: effect of age on prognosis of MI • Restriction: Male / White / Uncomplicated anterior wall MI • Important extraneous factors controlled for: sex / race / severity of disease • Limitation: results not generalizable to females, people of non-white community, those with complicated MI.
Matching - definition • The process of making a study group and a comparison group comparable with respect to extraneous factors. (Last) • For each patient in one group there are one or more patients in the comparison group with same characteristics, except for the factor of interest.(Fletcher)
THANK YOU THANK YOU