Download

1 / 16
160 likes | 313 Views
Modeling Tropical Cyclone Gridded Wind Field Forecasts. 26th Conference on Hurricanes and Tropical Meteorology 3—7 May 2004 Miami, FL Ken Waters Joel Cline National Weather Service Honolulu, Hawaii. Modeling Tropical Cyclone Gridded Wind Field Forecasts. Background Process/Algorithm

E N D
Modeling Tropical Cyclone Gridded Wind Field Forecasts 26th Conference on Hurricanes and Tropical Meteorology3—7 May 2004Miami, FL Ken Waters Joel Cline National Weather Service Honolulu, Hawaii
Modeling Tropical Cyclone Gridded Wind Field Forecasts • Background • Process/Algorithm • Issues • Results • Future Plans
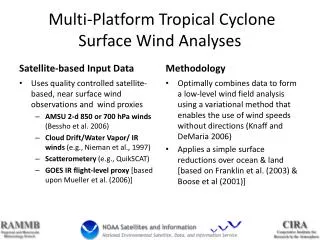
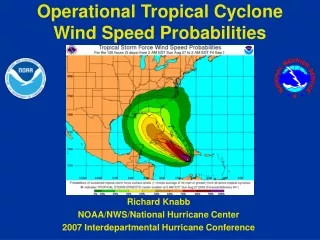
Background: Purpose • The goal: • An hourly forecast estimate of surface wind speeds and direction for 31 island points in the West Pacific • Needed for: • Terminal Aviation Forecasts (TAFs) for 24-hour period • Hourly wind forecast needed to help determine start/stop times for Tropical Storm and Typhoon Watches and Warnings • Wind grid information for possible initialization of digital wind grids (National Digital Forecast Database)
Background: Source Warnings • Official Tropical Cyclone Warnings are produced by the DoD Joint Typhoon Warning Center in Pearl Harbor • Forecast of position and maximum sustained wind speed for Hours 00, 12, 24, 36, 48, 72, 96, and 120 • Estimated wind radii by quadrant for Hours 00-72
Background: JTWC forecast Initial Position Lat/Long Max Wind 12 Hour Forecast Lat/Long Max Wind 24 Hour Forecast
Background: JTWC forecast – Example Graphic Showing Wind Radii Information
Process/Algorithm: Rankine Vortex • Anthes (1982): V(r) = Velocity at distance “r” from center of storm V(R0) = Maximum Wind Speed at Radius of Maximum Wind, R0 x = exponential “form factor”, typically between 0.5 and 0.7 r0 = Radius of storm influence
Process/Algorithm: Rankine Vortex • For winds inside the Radius of Maximum Wind (RMW), use:
Process/Algorithm: • Interpolate storm forecast to obtain hourly positions and maximum wind speed • Apply the wind formula for a regular grid centered upon the storm at each hourly position as well as for selected point locations (e.g., islands) at each hour based on distance from storm to the island • Compute simple wind direction orthogonal to line between the storm and the point
Process/Algorithm: • National Digital Forecast Database requires offices to produce surface wind grids of at least 5 km resolution every 3 hours • Following example shows a method of populating the wind field based solely on the wind radii (quadrant) information inside the warning --- not using Rankine vortex
Issues: • Determination of Radius of Maximum Wind (RMW) --- not part of forecast but input to the formula • Determination of the exponential “shape” factor • How rapidly does wind speed fall off as one moves away from center? • Variances include spectrum from huge storm down to “midget” typhoons • Inherent dangers with using a highly deterministic approach to describe difficult-to-predict tropical cyclone movement and intensity
Results: Typhoon Sudal Apr 9, 2004Warning #20 SYMMETRIC MODEL PREDICTED WINDS FOR: Koror Ngulu Yap 0 340 25 334 56 59 69 1 339 26 330 59 66 73 2 338 26 325 62 74 77 3 337 27 319 66 84 81 4 336 27 312 69 95 84 5 335 28 304 72 106 84 6 334 28 296 74 118 83 7 333 29 286 76 128 80 8 332 29 277 76 136 76 9 330 30 267 75 144 72 10 329 31 259 73 150 68 11 327 31 251 70 154 64 12 326 32 245 67 158 61 13 324 32 241 63 164 59 14 321 33 238 59 169 56 15 319 33 236 56 173 54 16 316 33 234 53 176 52 17 314 34 232 50 180 50 18 311 34 231 48 182 48 HOURLY POSITION/CLOSEST POINT: # Lat Lon Wind Mvmt Dstnc/Dirctn from (naut mi) 0 8.8 138.5 110.0 282 8 55 SSE Yap 1 8.8 138.4 110.4 282 8 50 SSE Yap 2 8.9 138.3 110.8 282 8 45 SSE Yap 3 8.9 138.2 111.2 282 8 42 S Yap 4 8.9 138.0 111.7 282 8 40 S Yap 5 8.9 137.9 112.1 282 8 40 SSW Yap 6 8.9 137.8 112.5 282 8 42 SSW Yap 7 9.0 137.7 112.9 282 8 44 SW Yap 8 9.0 137.6 113.3 282 8 48 SW Yap 9 9.0 137.4 113.8 282 8 50 N Ngulu 10 9.1 137.3 114.2 282 8 53 N Ngulu
Future Plans • Asymmetric wind structure (moving storm) • Environmental blending (e.g., SW monsoon flow) • Verification (using…? QuikSCAT? Recon?) • Create netCDF grids for possible use in initializing National Digital Forecast Database wind grids • Explore methods to estimate exponential factor and Radius of Maximum Wind
Questions? • Text data files can be found at: • http://www.prh.noaa.gov/hq/regsci/wind • Graphics planned for this spring/summer Ken Waters Regional Scientist National Weather Service, Pacific Region 737 Bishop St., Ste. 2200 Honolulu, HI 808-532-6413, cell: 808-271-7204 Ken.waters@noaa.gov