Download
1 / 44
440 likes | 597 Views
World Agricultural Outlook Board Interagency Commodity Estimates Committee Forecasts. May 9 , 2014. World Wheat Production. TURKEY. SYRIA. IRAN. IRAQ. MIDDLE EAST Winter Grains Crop Situation. 23 – 30 Apr 2014. TURKEY. SYRIA. IRAN. IRAQ. NDVI Anomaly above average

E N D
World Agricultural Outlook BoardInteragency Commodity Estimates Committee Forecasts May 9, 2014
World Wheat Production May 9, 2014
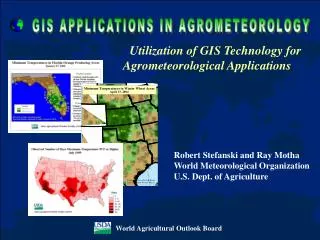
TURKEY SYRIA IRAN IRAQ MIDDLE EAST Winter Grains Crop Situation 23 – 30 Apr 2014 TURKEY SYRIA IRAN IRAQ NDVI Anomaly above average below May 9, 2014 MODIS satellite NASA GSFC
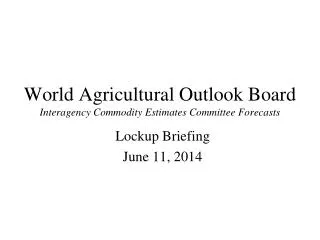
MODIS Aqua Satellite Composite NDVI Percent Anomaly Image Comparison to mean: 04/23 - 04/30 2014 Sweden Denmark Ireland United Kingdom Poland Germany Czech Slovakia Austria France Hungary Romania Croatia Serbia Italy Bulgaria 4/23 – 4/30 2013 Spain Greece May 9, 2014
World Wheat Supply and Use May 9, 2014
U.S. Wheat Supply and Demand May 9, 2014
World Rice Production May 9, 2014
World Rice Supply and Use May 9, 2014
U.S. Rice Supply and DemandRough Equivalent of Rough and Milled Rice May 9, 2014
World Corn Production May 9, 2014
Abandonment is forecast at nearly 7 percent, twice the 5-year average. May 9, 2014 Source: State Statistical Committee
Corn planting was 79% complete by May 8. May 9, 2014 Source: MinAg
GTIS data are available only through January. • Louis-Dreyfus analyst reports that corn-hybrid seed imports were up 50 percent at the end of February. • An estimated 25 to 50 percent of total corn area is planted with hybrid seed. May 9, 2014 Sources: GTIS (seed imports); USDA (yield)
According to chief APK-Inform analyst, the decrease and fluctuation of the value of the UAH in 2009 had an unfavorable impact on spring-crop yields in Ukraine. May 9, 2014
A 40-percent drop in the value of the UAH has increased prices for fuel, fertilizer, and chemicals. Producers will compensate by: • using cheaper materials; • purchasing untreated seed and treating it themselves; • focusing on fields with higher yield potential; • consolidating field operations. • Weather remains the top yield determinant. May 9, 2014
World Corn Supply and Use May 9, 2014
U.S. Corn Supply and Demand May 9, 2014
Corn Yield • Yield = F (mid-May planting, July temperatures and precipitation, and June precipitation if extremely dry) • 8-State Corn Belt area (IL, IN, IA, MN, MO, NE, SD, OH) • States normally account for about 75 percent of production Source: Westcott and Jewison, Weather Effects on Expected Corn and Soybean Yields, USDA-ERS, Feed Outlook No. (FDS-13G-01), July 2013. • July temperature and precipitation assumed at the 1988-2013 means • 8-state planting progress as of mid-May • Ag Outlook Forum trend of 165.3 assumed normal mid-May planting progress • May 15, 2014, unknown until the May 19thCrop Progress report • May 4th progress at 29.1 percent for 8-state region, well ahead of last year at this time, but behind normal. May 9, 2014
Corn Planting Progress 5/15 Source: NASS, Quick Stats 2.0 May 9, 2014
Corn Weather-Adjusted Trend Yield vs. Actual and Projected May 9, 2014
World Soybean Production May 9, 2014
U.S. Soybean Supply and Demand May 9, 2014
Soybean Weather-Adjusted Trend Yield vs. Actual and Projected
World Cotton Production May 9, 2014
NSW/QLD Border Region Cumulative Precipitation May 1 – April 30 Percent of Normal Rainfall 2011/12 = 150% 2012/13 = 97% 2013/14 = 73% May 9, 2014
How does El Nino Impact Australian Cotton? Much too early to determine El Nino’s impact on production… …but the perceived threat may drive acreage. May 9, 2014
World Cotton Supply and Use May 9, 2014
U.S. Cotton Supply and Demand May 9, 2014
Three-Year Running Annual Precipitation Totals, Lubbock, TX Driest 3-Year Periods 2011-13 1952-54 1951-53 1954-56 1953-55 Wettest 3-Year Periods 1967-69 1985-87 2006-08 2008-10 2007-09 May 9, 2014
3-Year Average: 55.5” May 9, 2014
Cotton Abandonment RatesMay 2014 WASDE May 9, 2014
U.S. Cotton Yield/Harvested Acre 2006-2013 and May 2014 Projection May 9, 2014
Mexico Sugar Supply and Demand May 9, 2014
U.S. Sugar Supply and Demand May 9, 2014
U.S. Meat Production and Prices May 9, 2014
U.S. Meat TradeMillion Pounds May 9, 2014
U.S. Milk Supply and Demand May 9, 2014
U.S. Dairy Product Prices May 9, 2014
U.S. Production Summary May 9, 2014
Domestic Demand Summary May 9, 2014
U.S. Export Summary May 9, 2014
2013/14 2014/15 Change from estimate forecast 2013/14 Percent Crops and products Wheat ($/bu) 6.85 7.30 6.6 Rice ($/cwt) 16.10 15.50 -3.7 Corn ($/bu) 4.65 4.20 -9.7 Soybeans ($/bu) 13.10 10.75 -17.9 Soybean oil (¢/lb) 40.00 39.00 -2.5 Soybean meal ($/s.t.) 485.00 375.00 -22.7 Cotton (¢/lb) 77.50 73.00 -5.8 Livestock Steers ($/cwt) 146.1 150.8 3.2 Hogs ($/cwt) 77.9 72.8 -6.6 Broilers (¢/lb) 103.4 103.8 0.4 Turkeys (¢/lb) 105.7 106.5 0.8 Dairy products Cheese 2.01 1.72 -14.5 Butter 1.83 1.68 -8.2 Nonfat dry milk 1.84 1.64 -10.9 Dry whey 0.64 0.57 -11.1 Milk classes Class III ($/cwt) 20.70 17.40 -15.9 Class IV ($/cwt) 21.45 19.10 -11.0 All milk ($/cwt) 22.85 20.20 -11.6 Price Summary May 9, 2014