Download
1 / 17
170 likes | 309 Views
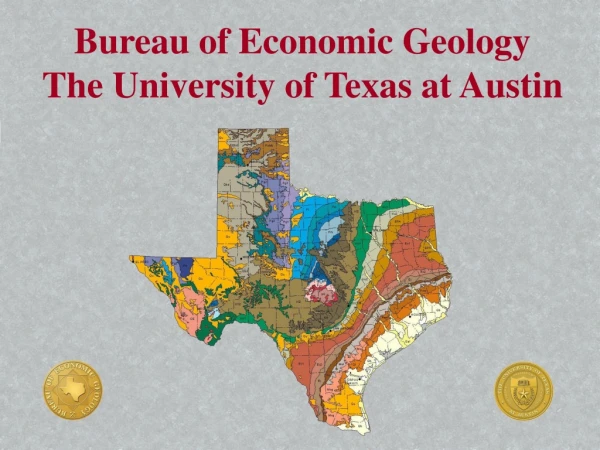
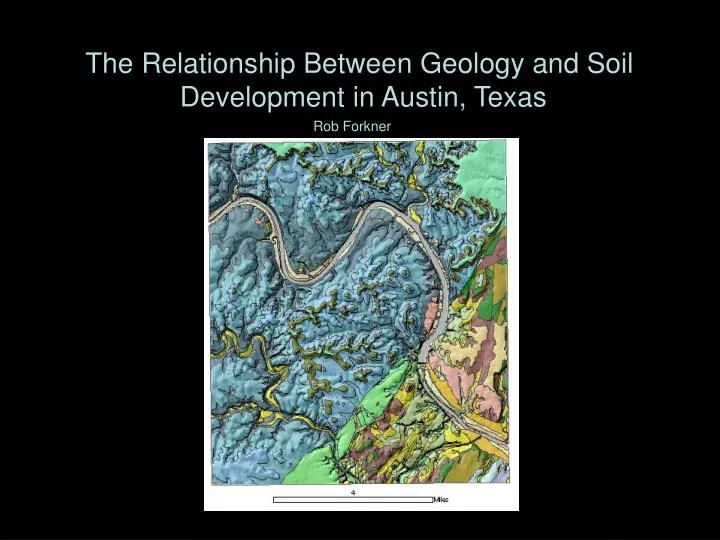
The Relationship Between Geology and Soil Development in Austin, Texas. Rob Forkner. Map courtesy of Sue Hvorka, BEG. Mt. Bonnell Fault. View from the top of Mt. Bonnell. Outcrop of the Glen Rose Limestone at Mt. Bonnell. Skimpy soil at Mt. Bonnell.

E N D
The Relationship Between Geology and Soil Development in Austin, Texas Rob Forkner
VS. Inceptisol Vertisol Images from USDA
Shrink/Swell factor in Austin Soils Shrink/Swell in soil is a function of seasonality (wet/dry) and amount of illitic clay within the soil matrix. Map from STATSGO, TX statewide Soil data.
How can we use spatial analysis to determine a more quantitative relationship between soils and bedrock? • Rasterize data so that spatial analyst can work with it. • Reclassify data into groups of similar erodability. • Assign weights to erodability groups: • higher weight = more erodable • 4) Add raster layers to determine combined erodability. Method Developed by Dr. Mark Helper, UT DOGS
Rasterized geological map with geological units grouped into formations. Reclassified geological map with formations classified into erodability groups. More resistant rocks have lower erodability. Limestone=1, Marl=2 Alluvium=3
Slopes on Austin West DEM reclassified into 4 groups with 20 degree increments. Steeper slopes are “colder”. 1-20 deg=1; 21-40 deg=2, etc. Slope calculation applied to Austin West DEM
Annual precip for Austin, 2001. Map from NRCS/USDA Brown area gets 1-1.5 inches more precip. per year. For erosion weighting, Blue area = 1, brown area = 2
The Combination… Geology- Limestone = 1; Marl = 2; Alluvium = 3 Slope- 0-20 deg. = 1; 21-40 deg. = 2; 41-60 deg. = 3 60-80 deg. = 4 Precipitation- Most of the map = 1 (appx. 31”); with a small area in the southeast being 2 (appx. 33”)
VIOLA! Sum of Raster Data Calculation of “erodability” as a function of bedrock, precipitation, and slope. darker areas are more readily erodable. In general, rock on the upthrown side of the fault is less erodable than the rock on the downthrown side.
What’s Next? • Add a erodability parameter for vegetation cover and soil • Be more quantifiable with parameters for rock