Download

1 / 17
170 likes | 190 Views
Analysis of CCA modes reveals correlations between Pacific-Atlantic patterns and Caribbean rainfall. Roc curves show skill levels by station. Skill maps indicate forecasting accuracy for various locations. Probability forecast suggests trends in rainfall patterns over the Eastern Caribbean.

E N D
CPT Experiments GROUP 2
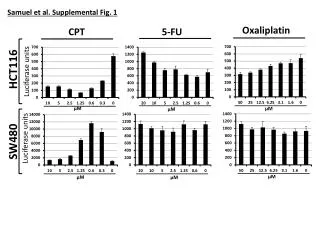
Goodness Index • CCA mode: 3 • X modes: 10 • Y modes: 4 • Goodness Index: -0.047
Pearson correlation skill map Map shows a low correlation skill across the rainfall stations.
CCA mode 1 Cool Pacific – Warm Atlantic Pattern corresponding to above normal rainfall over Eastern Caribbean Canonical correlation: 0.8288
CCA mode 2 Cool Equatorial Pacific (La Nina) –Warm Equatorial Atlantic corresponding to above normal rainfall over Eastern Caribbean Rainfall pattern not coherent over Eastern Caribbean Canonical correlation: 0.6430
Roc curves Station 14 showing low ROC skill
Roc curves Station 17 showing high ROC skill
CPT Experiment # 2 GROUP 2
Goodness Index • CCA mode: 4 • X modes: 5 • Y modes: 5 • Goodness Index: 0.032
Pearson correlation skill map Map shows reasonable skill across the Eastern Caribbean rainfall stations.
CCA mode 1 Cool Pacific – Cool Atlantic Pattern corresponding to below normal rainfall over Eastern Caribbean Timeseries shows long term trend Canonical correlation: 0.8030
CCA mode 2 Cool Equatorial Pacific (La Nina) –Cool Equatorial Atlantic corresponding to above normal rainfall over Caribbean Timeseries shows interannual variability Canonical correlation: 0.7221
Roc curves Station 26 (Grenada) showing low ROC skill
Roc curves Station 15 (Cayman) showing high ROC skill
Roc Map Map suggests good skill in predicting above normal rainfall and below normal rainfall over Trinidad and Tobago, Barbados and Cayman. Poor skill is evident over Jamaica, Surinaman and Grenada.
ProbabilityForecast There is a tendency towards normal to below normal rainfall over Eastern Caribbean.