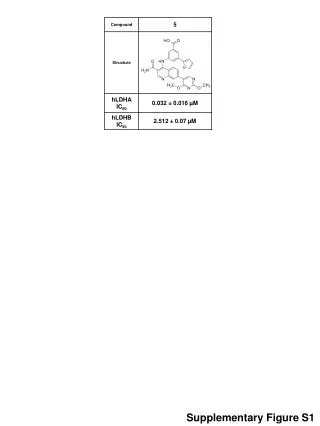
Download
1 / 2
20 likes | 125 Views
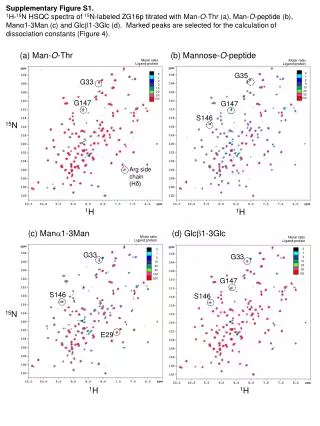
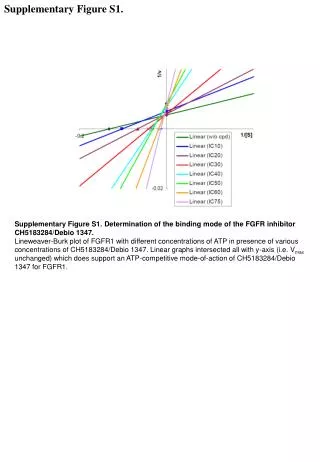
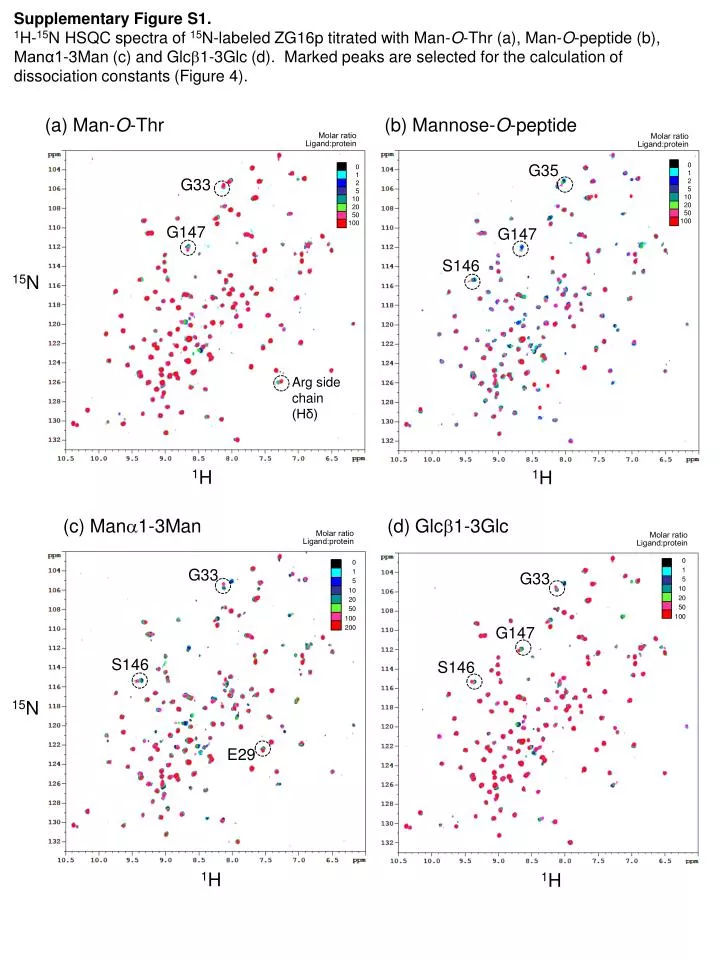
Supplementary Figure S1. 1 H- 15 N HSQC spectra of 15 N-labeled ZG16p titrated with Man- O - Thr (a), Man- O -peptide (b), Manα1-3Man (c) and Glc 1-3Glc (d). Marked peaks are selected for the calculation of dissociation constants (Figure 4). (a) Man- O -Thr. (b) Mannose- O -peptide.

E N D
Supplementary Figure S1. 1H-15N HSQC spectra of 15N-labeled ZG16p titrated with Man-O-Thr (a), Man-O-peptide (b), Manα1-3Man (c) and Glc1-3Glc (d). Marked peaks are selected for the calculation of dissociation constants (Figure 4). (a) Man-O-Thr (b) Mannose-O-peptide Molar ratio Ligand:protein Molar ratio Ligand:protein G35 0 1 2 5 10 20 50 100 0 1 2 5 10 20 50 100 G33 G147 G147 S146 15N Arg side chain (Hδ) 1H 1H (c) Mana1-3Man (d) Glcb1-3Glc Molar ratio Ligand:protein Molar ratio Ligand:protein 0 1 5 10 20 50 100 0 1 5 10 20 50 100 200 G33 G33 G147 S146 S146 15N E29 1H 1H
Supplementary Figure S2. The observed electron density of each ligand. Fo-Fc electron density maps of each ligand are shown in gray mesh, countered at 1s level ((a), (c) and (d)) or 0.5s level (b). (a) Man-O-Ser/ZG16p, (b) Man-O-Thr/ZG16p, (c) Manα1-3Man/ZG16p and (d) Glc1-3Glc/ZG16p. (b) Man-O-Thr (a) Man-O-Ser Tyr104 Tyr104 Ser 148 Ser 148 Asp 151 Asp 151 (d) Glcb1-3Glc (c) Mana1-3Man Tyr104 Ser 148 Tyr104 Ser 148 Asp 151 Asp 151