Download
1 / 23
230 likes | 315 Views
A. Supplementary Figure S1. B. Supplementary Figure S1. C. Supplementary Figure S1. D. Supplementary Figure S1. D. A. our 5' cluster > 5ppm 32,808. GIS-RNA-PET 5' cluster > 5ppm 7,564. 6,503. B. C. GIS-RNA-PET 3' cluster > 5ppm 7,624. our 3' cluster > 5ppm 42,945.

E N D
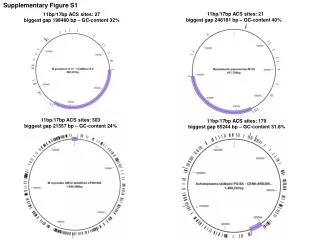
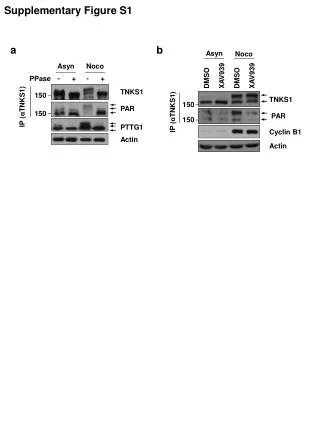
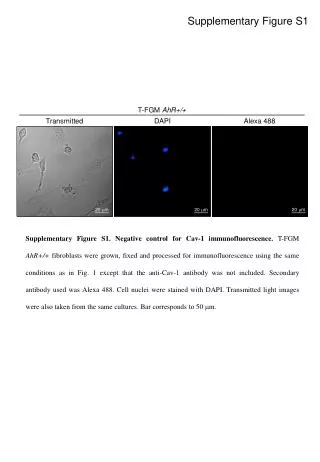
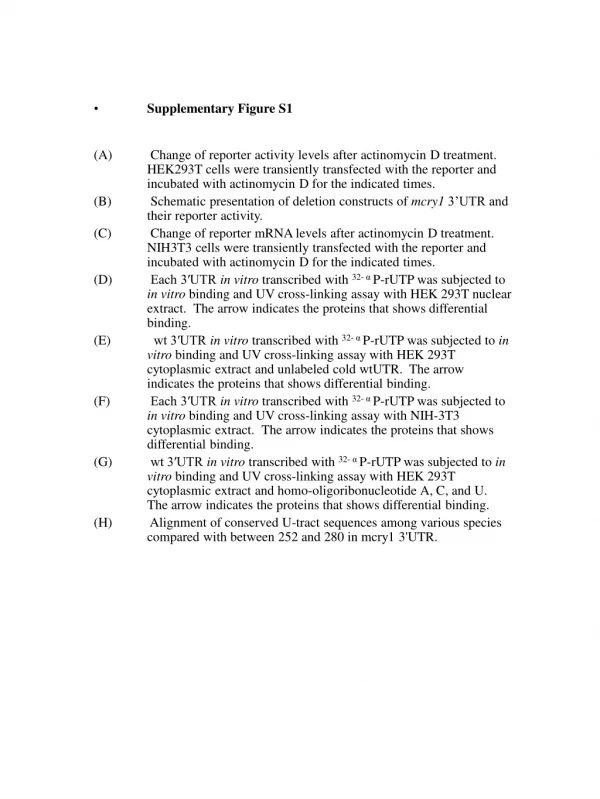
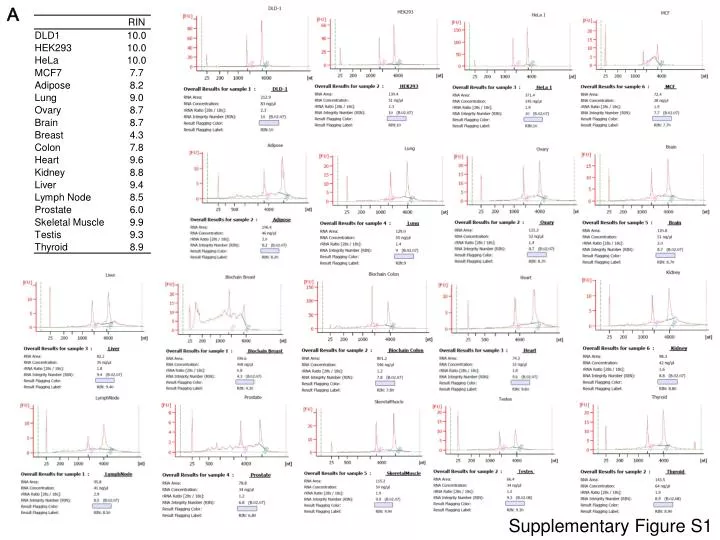
A Supplementary Figure S1
B Supplementary Figure S1
C Supplementary Figure S1
D Supplementary Figure S1
D A our 5'cluster > 5ppm 32,808 GIS-RNA-PET 5' cluster > 5ppm 7,564 6,503 B C GIS-RNA-PET 3' cluster > 5ppm 7,624 our 3'cluster > 5ppm 42,945 6,274 E (top) F TSS tags in Hs PA-seq 3' cluster > 5ppm 59,692 our 3'cluster > 5ppm 42,945 12,250 Random tags in Hs Gene model in Hs Gene model in Dm Sequence alignment Random tags in Dm TSS tags in Dm Supplementary Figure S2
E (bottom) Supplementary Figure S2
H G % First base of the TSS The last bases of the cap-oligo I tags The last bases of the cap-oligo Genome sequence 5’-> 3’ GA GT GG GC GAPDH chr12: 6643680-6643697 chr1:85,877,055-86,045,353 86,040 kb 85,960 kb 85,880 kb TSS tags in DLD1 RefSeq gene model Supplementary Figure S2 DDAH1 (dimethylargininedimethylaminohydrolase 1) 8%
J ARMC2 (NM_032131; chr6:109,169,619-109,295,675 , strand : plus) Number of RefSeq NM genes 109,300 kb 109,300 kb 109,200 kb 109,200 kb 109,250 kb 109,250 kb (tag count) 12,819 100 Distance from RefSeq NM_TSS (kbp) 0 Number of RefSeq NM genes Distance from Refseq start TSS1 : +7 bp Distance from Refseq start TSS2 : +68,519 bp Distance from RefSeq NM_TSS (kbp) ARMC2 (NM_032131; chr6:109,169,619-109,295,675 , strand : plus) 8,112 1,287 Number of RefSeq NM genes (tag count) Number of RefSeq NM genes 100 0 Distance from RefSeq NM_PAS (kbp) 19,091 Distance from Refseq end PAS1 : -94,217 bp Distance from Refseq end PAS2 : -939 bp Supplementary Figure S2
TSS PAS - + RT (tag count) 2kb 50000 ACTB (NM_001101) full 0 RT - + PAS TSS (tag count) FAH (NM_000137) 1.5kb 400 full 0 RT - + - + TSS PAS 3kb ICAM1 (NM_000201) (tag count) 200 Alternative TSC full 0 RT - + - + 2kb TSS PAS ACAD8 (NM_014384) (tag count) 200 full Alternative PAC 0 RT - + - + 2kb TSS PAS (tag count) TRIP10 (NM_004240) 30 full Alternative TSC - PAC 0 TSS PAS - + - + RT (tag count) 2kb GTPBP1 (NM_004286) 500 Alternative TSC Alternative PAC 0 Supplementary Figure S3
A C B CpG island overlapped Number of TSC pairs TATA motif Number of TSC pairs Poly(A)- addition signal motif Number of PAC pairs Supplementary Figure S4
A Supplementary Figure S5
% Signal intensity (Relative fold enrichment) B H3K4me3 H3K4me1 PolII H3K27Ac H3K36me3 CTD-PS2 CTCF Rad21 H3K27me3 DLD1 >5ppm <5ppm 100 0 IP/WCE fold average % 100 0 IP / WCE fold average HEK293 >5ppm <5ppm IP/WCE fold average IP / WCE fold average MCF7 >5ppm <5ppm IP/WCE fold average IP / WCE fold average -5 TSS 5 -5 TSS 5 -5 TSS 5 -5 TSS 5 TSS PAS -5 PAS 5 TSS PAS TSS PAS TSS PAS Supplementary Figure S5
% Signal intensity (Relative fold enrichment) C H3K4me3 H3K4me1 PolII H3K27Ac H3K36me3 CTD-PS2 CTCF Rad21 H3K27me3 DLD1 “Preferred” TSC-PACs in DLD1 “Preferred” TSC-PACs in other cell types 100 0 % 100 0 IP/WCE fold average IP / WCE fold average HEK293 “Preferred” TSC-PACs in HEK293 “Preferred” TSC-PACs in other cell types IP/WCE fold average IP / WCE fold average MCF7 “Preferred” TSC-PACs in MCF7 “Preferred” TSC-PACs in other cell types IP/WCE fold average IP / WCE fold average -5 TSS 5 -5 TSS 5 -5 TSS 5 -5 TSS 5 TSS PAS -5 PAS 5 TSS PAS TSS PAS TSS PAS Supplementary Figure S5
A B C Supplementary Figure S6
TSS PAS TSS PAS (tag count) RT - + 600 0 1.5kb NDUFA13/YJEFN3 PAS TSS PAS TSS - + (tag count) 2kb 4000 RT VAMP8/VAMP5 0 1.5kb PAS TSS - + PAS TSS (tag count) HLA-A/ HLA-J RT 10000 1.2kb 0 TSS PAS TSS PAS - + RPLP2/ CD151 (tag count) 30000 RT 1.5kb 0 - + PAS TSS TSS PAS HOXA4/ HOXA3 (tag count) 50 RT 0 Supplementary Figure S7
A Supplementary Figure S8
B RefSeq junction Tophatjunction (from split tag) Assembled model Supplementary Figure S8
Primers for validation analysis of the fusion gene (Fig. 5) Supplementary Table1
Primers for validation analysis of the TSCs and PACs (Fig. S3) Supplementary Table2
Primers for validation analysis of the ChIPSeq of histone modifications (Fig. S5) Supplementary Table3
Primers for validation analysis of the adjoining RefSeq transcripts (Fig. S7) Supplementary Table4
Primers for Validation analysis of the putative intergeniclncRNAs (Fig. S9) Supplementary Table5