Download
1 / 8
80 likes | 214 Views
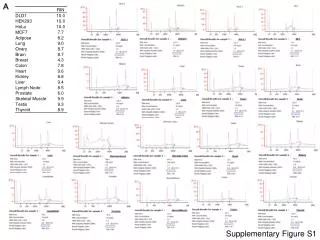
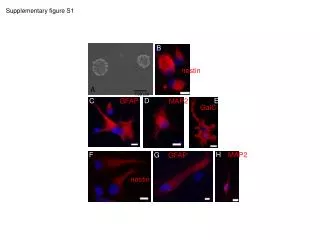
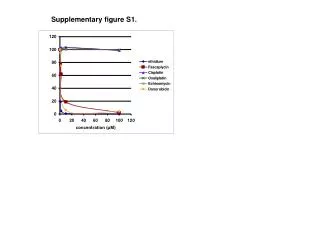
Supplementary Figure S1. A. concentration in cell, m M. Cmpd 1. Cmpd 2. Cmpd 3. B. NADH. Cmpd IC50. 120 m M. 67 nM. 100. 60 m M. 43 nM. 30 m M. 22 nM. 75. 5 m M. 12 nM. % inhibition. 50. 25. -9. -8. -7. -6. -5. Compound 2. Supplementary Figure S2. A. 13 C.

E N D
A concentration in cell, mM Cmpd 1 Cmpd 2 Cmpd 3 B NADH Cmpd IC50 120 mM 67 nM 100 60 mM 43 nM 30 mM 22 nM 75 5 mM 12 nM % inhibition 50 25 -9 -8 -7 -6 -5 Compound 2 Supplementary Figure S2
A 13C 12C 13C 15N- 15N- 14N- Arg/Lys Arg/Lys Arg/Lys SILAC LLIVSNPVDILTYVAWK HEK293 SNU398 Trypsin digest Trypsin digest Spike LC-MS/MS LC-MS/MS 100 100 recomb LDHA Protein Concentration B SILAC % Relative Intensity % Relative Intensity HEK293 Prepare lysates Protein Concentration Mix 1:1 Ratio triplicate 0 0 973 975 977 973 975 977 Snu398 HEK293 rLDHA HEK293 C LDHA cell concentration LDHA copies/cell mM Hek293 5.4 3.8 x 10⁶ Snu398 2.9 x 10⁶ 1.5 HepG2 4.7 x 10⁶ 2.6 Supplementary Figure S3
A B A2780 MDA-MB-453 Snu423 NCI-H1395 Cal-27 MiaPaCa-2 HepG2 786-O Snu398 U251 HepG2 Kidney Melanoma Liver Colon Pancreas Breast LDHA LDHA LDHB LDHB b-actin b-actin C D LDHA, mM LDHA, mM E trxn 1, days trxn 2, days 2 3 4 7=0 2 4 7 WB LDHA + + + + + + + LDHAsi Supplementary Figure S4
A FBP, nmol/mln cells DMSO Cmpd 1 Cmpd 2 B FBP, nmol/mln cells < 0.3 DMSO Cmpd 1 Cmpd 2 Supplementary Figure S6
A Snu398 HepG2 relative pathway activity pentose phosphate glycolysis fatty acid synthesis glutaminolysis B Supplementary Figure S8