Download
1 / 7
80 likes | 253 Views
Adult Mortality Rates . Noor Salem 6E. Introduction.

E N D
Adult Mortality Rates Noor Salem 6E
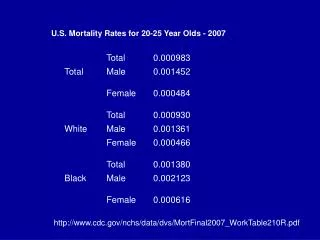
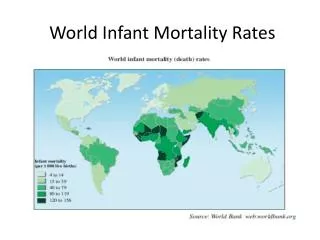
Introduction The Bar Graph and the Data Table shown in the next couple of slides both show the Adult Mortality Rates for both genders in the year 2007. The country I represent is Swaziland, and the 3 other countries are U.S.A, Ethiopia, & Jordan. It is a random selection of countries all around. People may be dying because of old age, many diseases, poorness… the reasons are unknown.
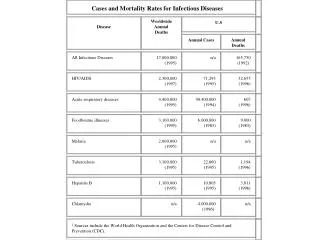
Explanation • Jordan and U.S.A’s Adult Mortality Rates are much lower than Ethiopia and Swaziland’s. If you look at the Adult Mortality Rate for Ethiopia and Swaziland you would see that 618 adults in Swaziland and only 316 adults in Ethiopia die each year out of 1000 live births. • Comparing Ethiopia and Swaziland, twice as much adults in Swaziland die each year for many unknown reasons.
Conclusion Swaziland has the worst Adult Mortality rates because in Swaziland, more than half of the people per 1000 die each year! Swaziland is a poor country that is desperate for money, food and more. & Did you know that the poorer the country, the worse the health gets! Therefore, I believe that the United Nations should be able to support as well as help Swaziland after looking at the no. of adults dying in the country each year.
Sources • Information: • "World Health Statistics 2009." Www.who.int. Ed. Laragh Gollogly. Department of Health Statistics. 18 Apr. 2011 <http://www.who.int/whosis/whostat/EN_WHS09_Full.pdf>. • Pictures: • http://www.biyokulule.com/sawiro/sawirada_waaweyn/Djibouti%20blindman.jpg • http://woodycollins.typepad.com/.a/6a00e54f837cba8834010536c7443f970c-800wi