Download
1 / 40
400 likes | 534 Views
Smoothing mortality rates using R. Gary Brown & Julie Mills. Overview. Introduction Context Methodology Implementation Results Summary What’s next?. Introduction . Future mortality rates are published every two years Until 2004, by the Government Actuary’s Department (GAD)

E N D
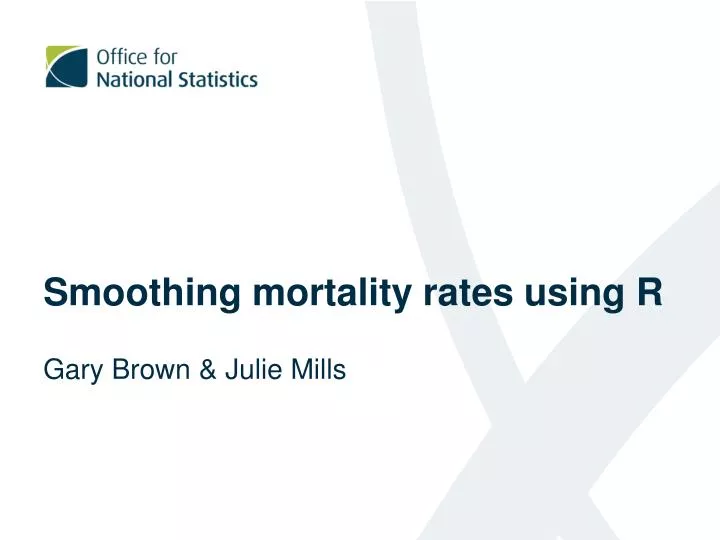
Smoothing mortality rates using R Gary Brown & Julie Mills
Overview • Introduction • Context • Methodology • Implementation • Results • Summary • What’s next?
Introduction • Future mortality rates are published every two years • Until 2004, by the Government Actuary’s Department (GAD) • Since 2006, by ONS (with GAD consultants) • The methodology was designed by GAD in the 1990s and runs in Excel • In 2010, ONS reviewed the current process • Implementation and testing still ongoing
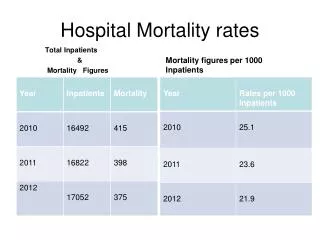
Context • Mortality rates, estimated 75 years into the future, are a key factor in National Population Projections (others: births and net migration) • Natural change (births – deaths) accounts for 1/3 of total population change • Population projections used as inputs/control totals for other government projections, such as numbers of school children or pensioners • Robustness of mortality rates is crucial
Methodology - current Mortality rate = deaths/pop
Methodology - current constrained survivor ratio Mortality rate = deaths/pop
Methodology - current constrained survivor ratio Mortality rate = deaths/pop Smooth within years (to 103/104)
Methodology - current constrained survivor ratio Mortality rate = deaths/pop extrapolate to age 120 Smooth within years (to 103/104)
Methodology - current constrained survivor ratio Mortality rate = deaths/pop extrapolate to age 120 Smooth within years (to 103/104) Estimate year T+1 for each age
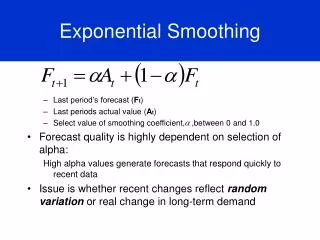
Methodology - current constrained survivor ratio Mortality rate = deaths/pop extrapolate to age 120 Smooth within years (to 103/104) exponential smoothingx2 Estimate year T+1 for each age
Methodology - current constrained survivor ratio Mortality rate = deaths/pop extrapolate to age 120 Smooth within years (to 103/104) exponential smoothingx2 Estimate year T+1 for each age Smooth improvement rate in T+1
Methodology - current constrained survivor ratio Mortality rate = deaths/pop extrapolate to age 120 Smooth within years (to 103/104) exponential smoothingx2 Estimate year T+1 for each age 1x1 3x1 5x1 3x1 1x1 MAs Smooth improvement rate in T+1
Methodology - current constrained survivor ratio Mortality rate = deaths/pop extrapolate to age 120 Smooth within years (to 103/104) exponential smoothingx2 Estimate year T+1 for each age 1x1 3x1 5x1 3x1 1x1 MAs Smooth improvement rate in T+1 Improvement rates up to T+26
Methodology - current constrained survivor ratio Mortality rate = deaths/pop extrapolate to age 120 Smooth within years (to 103/104) exponential smoothingx2 Estimate year T+1 for each age 1x1 3x1 5x1 3x1 1x1 MAs Smooth improvement rate in T+1 T+26 expert opinions Improvement rates up to T+26
Methodology - current constrained survivor ratio Mortality rate = deaths/pop extrapolate to age 120 Smooth within years (to 103/104) exponential smoothingx2 Estimate year T+1 for each age 1x1 3x1 5x1 3x1 1x1 MAs Smooth improvement rate in T+1 T+26 expert opinions Improvement rates up to T+26 Mortality rates for T+1 to T+26
Methodology - current constrained survivor ratio Mortality rate = deaths/pop extrapolate to age 120 Smooth within years (to 103/104) exponential smoothingx2 Estimate year T+1 for each age 1x1 3x1 5x1 3x1 1x1 MAs Smooth improvement rate in T+1 T+26 expert opinions Improvement rates up to T+26 … further adjustments Mortality rates for T+1 to T+26
Methodology - current constrained survivor ratio Mortality rate = deaths/pop extrapolate to age 120 Smooth within years (to 103/104) exponential smoothingx2 Estimate year T+1 for each age 1x1 3x1 5x1 3x1 1x1 MAs Smooth improvement rate in T+1 T+26 expert opinions Improvement rates up to T+26 … further adjustments Mortality rates for T+1 to T+26
Methodology - new • Replace two-stage smoothing process • Smooth mortality rates surface simultaneously over ages and years • Estimate improvement rate using existing smoothed years – ie do not estimate T+1 • Requires longer path to T+26 opinions!
Methodology – 2 dimensional p-spline • Thoroughly tested, and recommended, by Continuous Mortality Investigation
Methodology – 2 dimensional p-spline • Thoroughly tested, and recommended, by Continuous Mortality Investigation
Methodology – 2 dimensional p-spline • Thoroughly tested, and recommended, by Continuous Mortality Investigation
Methodology – 2 dimensional p-spline • Thoroughly tested, and recommended, by Continuous Mortality Investigation • Best advice - read “Smoothing and forecasting mortality rates”, Currie et al, 2004!
Implementation • Difficult to understand (and explain) … but easy to implement!
Implementation • Difficult to understand (and explain) … but easy to implement! • MortalitySmooth (Carlo G Camarda) in R
Implementation • Difficult to understand (and explain) … but easy to implement! • MortalitySmooth (Carlo G Camarda) in R Mort2Dsmooth(x=ages,y=years,Z=deaths,offset=log(pop))
Implementation • Difficult to understand (and explain) … but easy to implement! • MortalitySmooth (Carlo G Camarda) in R Mort2Dsmooth(x=ages,y=years,Z=deaths,offset=log(pop)) • Smoothed values = 21st entry in list of R output
Results - testing 61-04 61-05 61-09 61-06 61-07 61-08 10 20 30 40 50 60 70 80 90 0 Mortality improvement rates by age, 2003/04 6 5 % 4 3 2 1 0 102 Age
Results – mortality rates in the base year Issues • New method does not project rates forward to base year • Edge effects Solution • Step back 2 years into the data set 2010 mortality rates = 2007 mortality rates x (1 – 2006-07 improvement rates/100) ^ 3
Results – mortality rates in the base year 100 52 yrs 49 48 48 yrs 0 1961………………………………………………….. 2007 2008 2009 2010 Age Year
Past improvements in smoothed mortality rates, males – old method
Past improvements in smoothed mortality rates, males – new method
Past improvements in smoothed mortality rates, Scotland males – new method
Past improvements in smoothed mortality rates, females – old method
Past improvements in smoothed mortality rates, females – new method
Comparison of projected smooth % changes in death rates by age, UK 2009-10 Males
Comparison of projected smooth % changes in death rates by age, UK 2009-10 Females
Comparison of actual and projected expectation of life at birth
Summary • New smoothing method used to produce the 2010-based ‘proposed’ mortality assumptions • Introduced in the 2010-based consultation with devolved administrations and government departments
What’s next? • More testing/evaluation: • Over-smoothing • Adding 2010 data • Derivation of base year rates • Using R to project mortality rates