Download
1 / 1
10 likes | 90 Views
Precipitation Measurements on the Ross Ice Shelf and Ross Island, Antarctica Shelley L. Knuth 1 , Gregory J. Tripoli 2 , and Charles R. Stearns 1 1 Automatic Weather Stations Project, Antarctic Meteorological Research Center 2 Department of Atmospheric and Oceanic Sciences

E N D
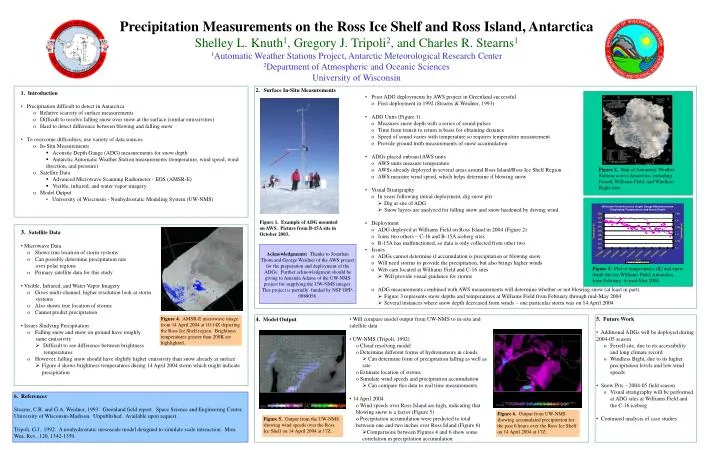
Precipitation Measurements on the Ross Ice Shelf and Ross Island, Antarctica Shelley L. Knuth1, Gregory J. Tripoli2, and Charles R. Stearns1 1Automatic Weather Stations Project, Antarctic Meteorological Research Center 2Department of Atmospheric and Oceanic Sciences University of Wisconsin • 1. Introduction • Precipitation difficult to detect in Antarctica • Relative scarcity of surface measurements • Difficult to resolve falling snow over snow at the surface (similar emissivities) • Hard to detect difference between blowing and falling snow • To overcome difficulties, use variety of data sources • In-Situ Measurements • Acoustic Depth Gauge (ADG) measurements for snow depth • Antarctic Automatic Weather Station measurements (temperature, wind speed, wind direction, and pressure) • Satellite Data • Advanced Microwave Scanning Radiometer - EOS (AMSR-E) • Visible, infrared, and water vapor imagery • Model Output • University of Wisconsin - Nonhydrostatic Modeling System (UW-NMS) • Surface In-Situ Measurements • Prior ADG deployments by AWS project in Greenland successful • First deployment in 1992 (Stearns & Weidner, 1993) • ADG Units (Figure 1) • Measures snow depth with a series of sound pulses • Time from transit to return is basis for obtaining distance • Speed of sound varies with temperature so requires temperature measurement • Provide ground truth measurements of snow accumulation • ADGs placed onboard AWS units • AWS units measure temperature • AWSs already deployed in several areas around Ross Island/Ross Ice Shelf Region • AWS measure wind speed, which helps determine if blowing snow • Visual Stratigraphy • In years following initial deployment, dig snow pits • Dig at site of ADG • Snow layers are analyzed for falling snow and snow hardened by driving wind • Deployment • ADG deployed at Williams Field on Ross Island in 2004 (Figure 2) • Joins two others – C-16 and B-15A iceberg sites • B-15A has malfunctioned, so data is only collected from other two • Issues • ADGs cannot determine if accumulation is precipitation or blowing snow • Will need storms to provide the precipitation, but also brings higher winds • Web cam located at Williams Field and C-16 sites • Will provide visual guidance for storms • ADG measurements combined with AWS measurements will determine whether or not blowing snow (at least in part) • Figure 3 represents snow depths and temperatures at Williams Field from February through mid-May 2004 • Several instances where snow depth decreased from winds – one particular storm was on 14 April 2004 Figure 2. Map of Automatic Weather Stations across Antarctica, including Ferrell, Williams Field, and Windless Bight sites. Figure 1. Example of ADG mounted on AWS. Picture from B-15A site in October 2003. • 3. Satellite Data • Microwave Data • Shows true location of storm systems • Can possibly determine precipitation rate • over polar regions • Primary satellite data for this study • Visible, Infrared, and Water Vapor Imagery • Gives multi-channel, higher resolution look at storm • systems • Also shows true location of storms • Cannot predict precipitation • Issues Studying Precipitation • Falling snow and snow on ground have roughly • same emissivity • Difficult to see difference between brightness • temperatures • However, falling snow should have slightly higher emissivity than snow already at surface • Figure 4 shows brightness temperatures during 14 April 2004 storm which might indicate precipitation Acknowledgments: Thanks to Jonathan Thom and George Weidner of the AWS project for the preparation and deployment of the ADGs. Further acknowledgment should be giving to Amanda Adams of the UW-NMS project for supplying the UW-NMS images. This project is partially funded by NSF OPP-0088058. Figure 3. Plot of temperatures (K) and snow depth (m) for Williams Field, Antarctica, from February to mid-May 2004. 4. Model Output • Will compare model output from UW-NMS to in-situ and satellite data • UW-NMS (Tripoli, 1992) • Cloud resolving model • Determine different forms of hydrometeors in clouds • Can determine form of precipitation falling as well as rate • Estimate location of storms • Simulate wind speeds and precipitation accumulation • Can compare this data to real time measurements • 14 April 2004 • Wind speeds over Ross Island are high, indicating that blowing snow is a factor (Figure 5) • Precipitation accumulation were predicted to total between one and two inches over Ross Island (Figure 6) • Comparisons between Figures 4 and 6 show some correlation in precipitation accumulation • Future Work • Additional ADGs will be deployed during 2004-05 season • Ferrell site, due to its accessibility and long climate record • Windless Bight, due to its higher precipitation levels and low wind speeds • Snow Pits – 2004-05 field season • Visual stratigraphy will be performed at ADG sites at Williams Field and the C-16 iceberg • Continued analysis of case studies Figure 4. AMSR-E microwave image from 14 April 2004 at 10:14Z depicting the Ross Ice Shelf region. Brightness temperatures greater than 200K are highlighted. 6. References Stearns, C.R. and G.A. Weidner, 1993: Greenland field report. Space Science and Engineering Center, University of Wisconsin-Madison. Unpublished. Available upon request. Tripoli, G.J., 1992: A nonhydrostatic mesoscale model designed to simulate scale interaction. Mon. Wea. Rev., 120, 1342-1359. Figure 6. Output from UW-NMS showing accumulated precipitation for the past 6 hours over the Ross Ice Shelf on 14 April 2004 at 17Z. Figure 5. Output from the UW-NMS showing wind speeds over the Ross Ice Shelf on 14 April 2004 at 17Z.