Download
1 / 2
30 likes | 195 Views
Upper Big Walnut Creek. Water Quality Partnership. EQIP Period. 40. 30. 20. Atrazine Load in Hoover Reservoir. 10. 0. 0. 10. 20. 30. 40. Atrazine Runoff from the Watershed. R 2 = not known. FIGURE 2: Upper Big Walnut Creek Watershed. Ohio. Morrow County. Delaware County.

E N D
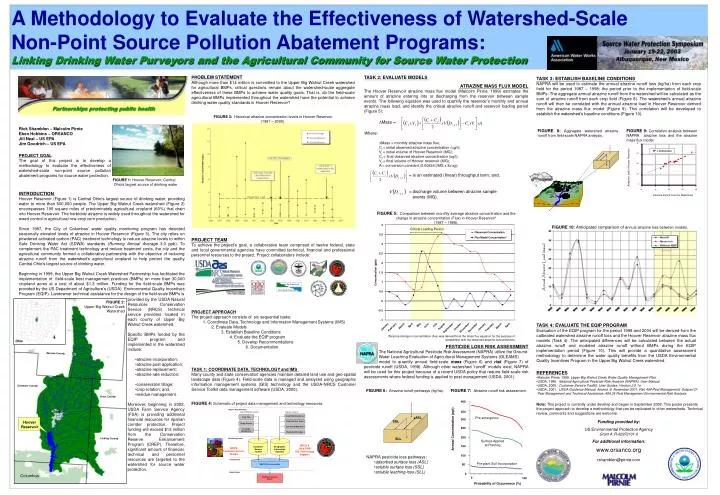
Upper Big Walnut Creek Water Quality Partnership EQIP Period 40 30 20 Atrazine Load in Hoover Reservoir 10 0 0 10 20 30 40 Atrazine Runoff from the Watershed R2 = not known FIGURE 2: Upper Big Walnut Creek Watershed Ohio Morrow County Delaware County Knox County 400 Require Data Elements Sunbury 350 Crop Production Features Physical Features Crop Field Boundaries Crop Type ASL Pre-emergence 300 SSL Crop Field Ave. Slope Hoover Reservoir Tillage Practice Soil Survey Map Units 250 Annual Concentration (ppt) Pesticide Management Watershed Boundary 200 Licking County SLL Data Management Customer Service Toolkit Geographic Information Systems Surface Applied at Planting NRCS & Ohio DNR GIS Technology Support 150 NRCS Customer Service Toolkit 100 Compile Data NAPRA Risk Assessment Pre-plant Soil Incorporation 50 Model Output 0 Columbus Field-Scale Atrazine Runoff 0 100 Probability of Occurrence (%) A Methodology to Evaluate the Effectiveness of Watershed-Scale Non-Point Source Pollution Abatement Programs:Linking Drinking Water Purveyors and the Agricultural Community for Source Water Protection PROBLEM STATEMENT Although more than $14 million is committed to the Upper Big Walnut Creek watershed for agricultural BMPs, critical questions remain about the watershed-scale aggregate effectiveness of these BMPs to achieve water quality goals. That is, do the field-scale agricultural BMPs implemented throughout the watershed have the potential to achieve drinking water quality standards in Hoover Reservoir? • TASK 2: EVALUATE MODELS • ATRAZINE MASS FLUX MODEL • The Hoover Reservoir atrazine mass flux model (Malcolm Pirnie, 1999) estimates the amount of atrazine entering into or discharging from the reservoir between sample events. The following equation was used to quantify the reservoir’s monthly and annual atrazine mass load, and identify the critical atrazine runoff and reservoir loading period (Figure 5): • Mass = • Where: • Mass = monthly atrazine mass flux; • Ci = initial observed atrazine concentration(ug/l); • Vi = initial volume of Hoover Reservoir(MG); • Cf = final observed atrazine concentration (ug/l); • Vf = final volume of Hoover reservoir (MG); • A = conversion constant (0.00834 l/MG x lb/ug); • = is an estimated (linear) throughputterm; and, • = discharge volume between atrazine sample events(MG). TASK 3: ESTABLISH BASELINE CONDITIONS NAPRA will be used to estimate the annual atrazine runoff loss (kg/ha) from each crop field for the period 1987 – 1998; the period prior to the implementation of field-scale BMPs. The aggregate annual atrazine runoff from the watershed will be calculated as the sum of atrazine runoff from each crop field (Figure 8). The watershed’s annual atrazine runoff will then be correlated with the annual atrazine load in Hoover Reservoir derived from the atrazine mass flux model (Figure 9). This correlation will be developed to establish the watershed’s baseline conditions (Figure 10). Partnerships protecting public health FIGURE 3: Historical atrazine concentration levels in Hoover Reservoir (1987 – 2000). Rick Shamblen – Malcolm Pirnie Eben Hobbins – ORSANCO Jill Neal – US EPA Jim Goodrich – US EPA FIGURE 8: Aggregate watershed atrazine runoff from field-scale NAPRA analysis. FIGURE 9: Correlation analysis between NAPRA atrazine loss and the atrazine mass flux model. PROJECT GOAL The goal of this project is to develop a methodology to evaluate the effectiveness of watershed-scale non-point source pollution abatement programs for source water protection. FIGURE 1: Hoover Reservoir, Central Ohio’s largest source of drinking water INTRODUCTION Hoover Reservoir (Figure 1) is Central Ohio’s largest source of drinking water, providing water to more than 600,000 people. The Upper Big Walnut Creek watershed (Figure 2) encompasses 190 square miles of predominately agricultural cropland (60%) that drain into Hoover Reservoir. The herbicide atrazine is widely used throughout the watershed for weed control in agricultural row-crop corn production. Since 1987, the City of Columbus’ water quality monitoring program has detected seasonally elevated levels of atrazine in Hoover Reservoir (Figure 3). The city relies on powdered activated carbon (PAC) treatment technology to reduce atrazine levels to within Safe Drinking Water Act (SDWA) standards (Running Annual Average 3.0 ppb). To complement the PAC treatment technology and reduce treatment costs, the city and the agricultural community formed a collaborative partnership with the objective of reducing atrazine runoff from the watershed’s agricultural cropland to help protect the quality Central Ohio’s largest source of drinking water. Beginning in 1999, the Upper Big Walnut Creek Watershed Partnership has facilitated the implementation of field-scale best management practices (BMPs) on more than 30,000 cropland acres at a cost of about $1.3 million. Funding for the field-scale BMPs was provided by the US Department of Agriculture’s (USDA) Environmental Quality Incentives Program (EQIP). Landowner technical assistance for the design of the field-scale BMPs is FIGURE 5: Comparison between monthly average atrazine concentration and the change in atrazine concentration (Flux) in Hoover Reservoir* (1987 – 1998). FIGURE 10: Anticipated comparison of annual atrazine loss between models. Critical Loading Period PROJECT TEAM To achieve the project’s goal, a collaborative team comprised of twelve federal, state and local governmental agencies have committed technical, financial and professional personnel resources to the project. Project collaborators include: Annual Atrazine Load (mass) • provided by the USDA Natural Resources Conservation Service (NRCS) technical service providers located in each county of Upper Big Walnut Creek watershed. • Specific BMPs funded by the EQIP program and implemented in the watershed include: • atrazine incorporation; • atrazine post-application; • atrazine replacement; • atrazine rate reduction; • conservation tillage; • crop rotation; and, • residue management. • Moreover, beginning in 2002, USDA Farm Service Agency (FSA) is providing additional financial resources for riparian corridor protection. Project funding will exceed $13 million from the Conservation Reserve Enhancement Program (CREP). Therefore, significant amount of financial, technical and personnel resources are targeted to the watershed for source water protection. • PROJECT APPROACH • The project approach consists of six sequential tasks: • 1. Coordinate Data, Technology and Information Management Systems (IMS) • 2. Evaluate Models • 3. Establish Baseline Conditions • 4. Evaluate the EQIP program • 5. Develop Recommendations • 6. Documentation TASK 4: EVALUATE THE EQIP PROGRAM Evaluation of the EQIP program for the period 1999 and 2004 will be derived from the calibrated watershed atrazine runoff loss and the Hoover Reservoir atrazine mass flux models (Task 4). The anticipated differences will be calculated between the actual atrazine runoff and modeled atrazine runoff without BMPs during the EQIP implementation period (Figure 10). This will provide a quantitative assessment methodology to determine the water quality benefits from the USDA Environmental Quality Incentives Program in the Upper Big Walnut Creek watershed. *Atrazine change in concentration (flux) was derived from the mass flux equation for the purpose of comparison with the observed atrazine concentrations. PESTICIDE LOSS RISK ASSESSMENT The National Agricultural Pesticide Risk Assessment (NAPRA) utilize the Ground Water Leaching Evaluation of Agricultural Management Systems (GLEAMS) model to quantify annual field-scale mass (Figure 6) and risk (Figure 7) of pesticide runoff (USDA, 1998). Although other watershed “runoff” models exist, NAPRA will be used for this project because of a recent USDA policy that require field-scale risk assessments where federal funding is applied to pest management (USDA, 2001). TASK 1: COORDINATE DATA, TECHNOLOGY and IMS Many county and state conservation agencies maintain detailed land use and geo-spatial landscape data (Figure 4). Field-scale data is managed and analyzed using geographic information management systems (GIS) technology and the USDA-NRCS Customer Service Toolkit data management software (USDA, 2000). • REFERENCES • Malcolm Pirnie, 1999. Upper Big Walnut Creek Water Quality Management Plan. • USDA, 1998. National Agricultural Pesticide Risk Analysis (NAPRA), User Manual. • USDA, 2000. Customer Service ToolKit, User Guides, Version 2.0.1a • USDA, 2001. USDA Guidance Manual, Amend. 6, November 2001. Part 404-Pest Management; Subpart D- • Pest Management and Technical Assistance; 404.35 Pest Management Environmental Risk Analysis. FIGURE 6: Atrazine runoff pathways (kg/ha). FIGURE 7: Atrazine runoff risk assessment. FIGURE 4:Schematic of project data management and technology resources. Note: This project is currently under develop and began in September 2002. This poster presents the project approach to develop a methodology that can be replicated in other watersheds. Technical review, comments and suggestions are welcome. Funding provided by: US Environmental Protection Agency Grant #: R-82972101-0 For additional information: www.orsanco.org rshamblen@pirnie.com • NAPRA pesticide loss pathways: • adsorbed surface loss (ASL) • soluble surface loss (SSL) • soluble leaching loss (SLL)
Hydrology Hydrology Sediment Sediment Nutrients Nutrients Pesticides Pesticides Model Name Model Name AGNPS AGNPS BASINS BASINS CREAMS CREAMS GLEAMS GLEAMS EQIP Period EQIP Period EQIP Period NAPRA* NAPRA* Win_PST Win_PST Field-Scale Model “Nested” Field-Scale Models Field-Scale Model “Nested” Field-Scale Models