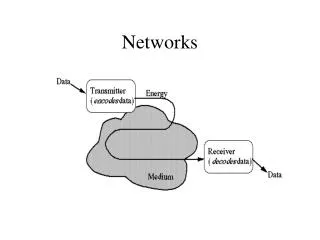
Download
1 / 24
240 likes | 390 Views
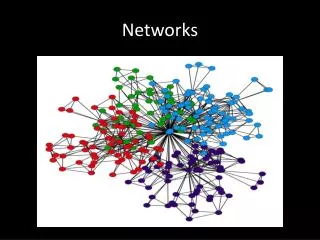
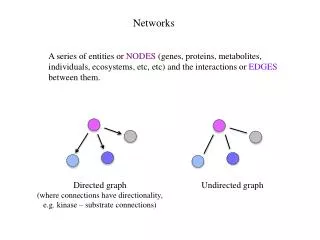
Networks. Mathematical Modelling and Genetic Epidemiology Group. Networks. Protein-protein Interactions Genealogies Boolean Nets. Protein interactions in yeast. Genealogy. Boolean Nets. Protein-protein interactions.

E N D
Networks Mathematical Modelling and Genetic Epidemiology Group
Networks • Protein-protein Interactions • Genealogies • Boolean Nets
Protein-protein interactions • Yeast 2 Hybrid observations of protein-protein interactions for any species. • Here we look at protein-protein interactions in yeast reported by Uetz et al and Ito et al.
Thomas et al (2003) • Analysis of the Y2H data of Uetz et al and of Ito et al. for yeast. • Uetz et al claimed power-law of vertex degrees Log Freq Log Vertex Degree
Random Graphs Rather than examine single examples ofgraphs we investigate whole classes ofgraphs generated in some random fashion.
Models of the Interaction Graph • 1.Erdos-Renyi. n nodes and each of the nC2 possible edges occurs with prob p. • 2. Power Law • 3.Domain model of Thomas et al. n proteins, 2d domains (e.g. A+ & A-). Any domain with any protein with fixed probability. Interaction iff two proteins have a matching pair (e.g. I+ and I-)
Erdos-Renyi • Erdos-Renyi (the classical random graph)n nodes V={1,2,....,n}, then each (unordered) edge (i,j) is presentwith probability p independently of all others
Protein Domains • Suppose the nodes correspond to proteins. • There is a set D={A+,A- ,B+,B-,.....,U+,U-} of domains, a protein has a random set of domains with probs p independently. • Two proteins are linked (react) if for some letter V one has V+ and the other V-.
The Domain Model for the interaction graph Each protein has domains drawn from a set S={A+,A-,B+,B-,…,N+,N-} and two proteins interact if they have any complementary domains, e.g. J+ and J-. NB. Each domain generates a complete bipartite component in the interaction graph
Domain Graph • The number of triangles is “small”. If we look at large N (number of proteins), large D (number of domains) where N=kD and p(prob domain assigned to each protein) where mu=DP is constant then there is only a finite number of triangles. • Number of odd cycles is small. • Number of even cycles increases faster than linear.
Fitting the data • Now 1 and 3 do not fit very well to the data. • 2 fits better though not well.
Generating the data Most interactions are found by labs investigating their particular favourites, introducing a bias towards clustering.
Uetz/Ito • The yeast screens of Uetz and Ito were done by testing a bait against a library of prey, and then sequencing from up to 12 colonies. Certainly not a random piece of the network.
Sampling • Take either Erdos-Renyi or the Domain model, and imitate the lab process by choosing proteins at random and then choosing a (geometrically distributed) random subset of its links. • We took 6k proteins and 1000 domains with average of 1 domain per protein.
Ascertainment • The Small World / Power Law model may well fit the data BUT this does not imply it fits the underlying world if sampling scheme is ignored.
Ito et al Uetz et al Domain I